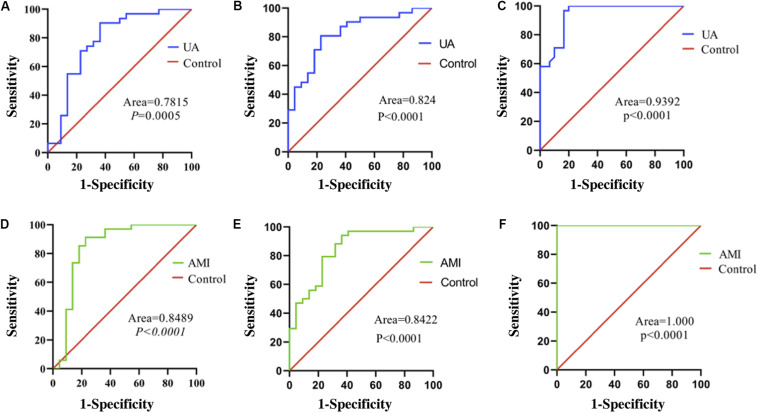
FIGURE 3.
ROC curves of relative expression levels of serum exosomal miR-126, miR-21, and PTEN. (A) Expression of miR-126 in patients with UA. (B) Expression of miR-126 in patients with AMI. (C) Expression of miR-21 in patients with UA. (D) Expression of miR-21 in patients with AMI. (E) Expression of PTEN in patients with UA. (F) Expression of PTEN in patients with AMI. Exo, exosomal.

