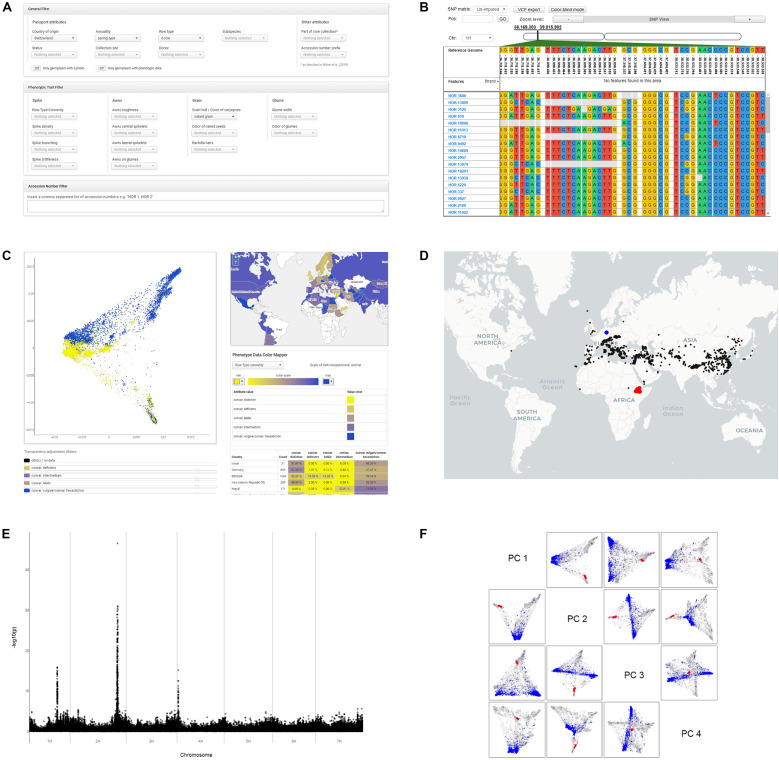
FIGURE 3.
Screenshots as illustrations of the most important search and visualization features, which can be used as an entry point for exploratory data analysis. (A) Data Filters: In the “Search Germplasm” panel, the user can search for germplasm by filtering passport attributes, phenotypic traits and SNP markers. (B) Genomic Diversity Visualization: In the integrated SNP browser users can inspect and subset the SNP matrices visually for different collections of germplasm. (C) Combined Interactive Visualizations: This tool enables the correlation of results of dimensionality reduction algorithms like PCA or t-SNE on the SNP data with countries of origin and phenotypic traits of the germplasm. (D) Interactive World Map: This tool allows the user to create lasso selections of geo-localized germplasm or to highlight user-defined germplasm collections with their specific tagging colors. (E) Manhattan Plots: This tool provides interactive plots of GWAS analysis results where each SNP data point is linked to the SNP browser. The user can click on a SNP data point and is then automatically guided to the corresponding genomic location in the SNP browser. (F) PCA Scatterplot Matrix: This visualization tool allows visual inspection of the first four principal components while highlighting user-defined germplasm collections with their specific tagging colors. It also allows to save custom lasso-selection of data points as a “named collection” of germplasm.

