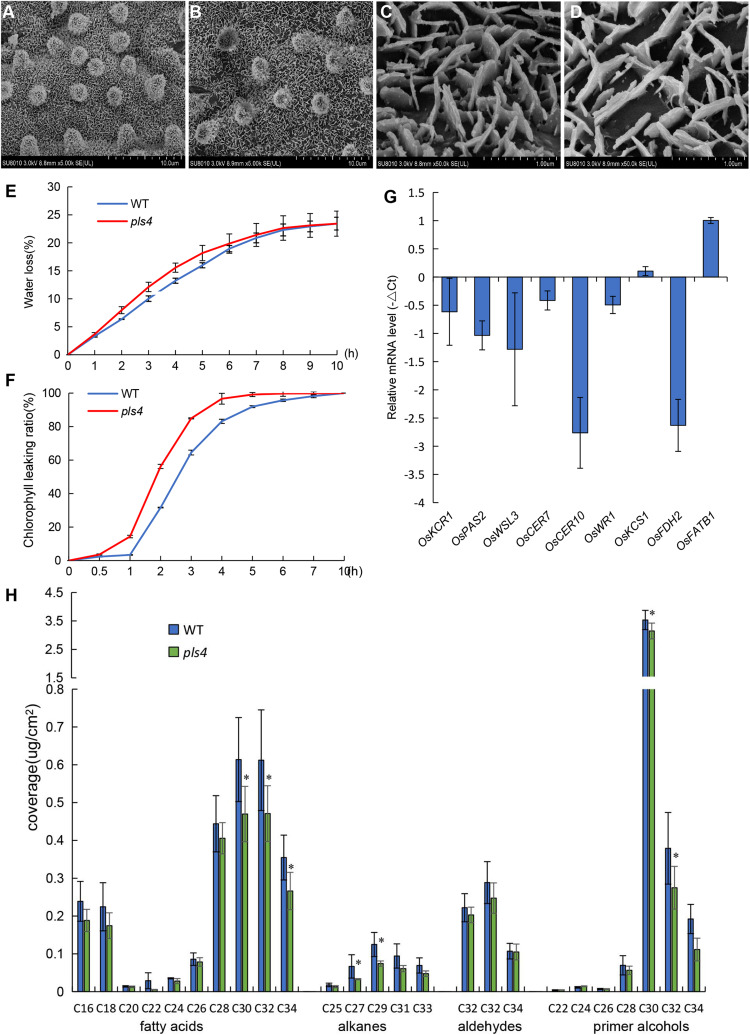
FIGURE 4.
Analysis of cuticular waxes in the leaves of the WT and pls4 mutant. (A–D) Cuticular wax crystals from the leaves of the WT (A,C) and pls4 mutant (B,D) at the heading stage by SEM. Bars = 50 μm (A,B), 5 μm (C,D). (E) Rate of water loss from detached leaves of the WT and pls4 mutant. (F) Chl leakage assays of leaves of the WT and pls4 mutant. (G) Relative expression of a set of genes associated with wax synthesis in the leaves of WT and pls4 mutant at the tillering stage. The data presented are the means ± SDs of three biological replicates. (H) Cuticular wax composition on the leaf surfaces of the WT and pls4 mutant analyzed by GC-MS. Asterisks denote significant differences from the WT. The data presented are the mean ± SD from five biological replicates. *P < 0.05 (Student’s t-test).

