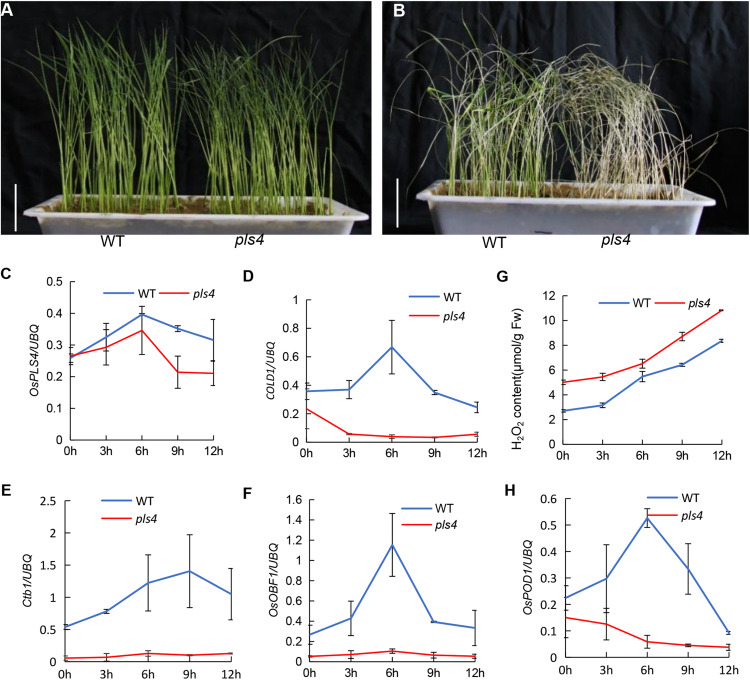
FIGURE 6.
Chilling stress at the seedling stage and related gene expression analysis. (A) The WT and pls4 mutant treated at 4°C for 72 h. Bar = 5 cm. (B) The WT and pls4 mutant treated at 4°C for 72 h, followed by recovery at 30°C/25°C day/night for 7 days. Bar = 5 cm. (C–F) Relative expression of OsPLS4 and genes associated with cold tolerance at different chilling treatment times for the WT and pls4 mutant. The genes included COLD1 (LOC_Os04g51180), Ctb1 (LOC_Os04g52830) and OsOBF (LOC_Os12g37410). (G) H2O2 content in the WT and pls4 mutant at different chilling treatment times. (H) Relative expression of OsPOD1 (peroxidases) in the WT and pls4 mutant at different chilling treatment times. The data presented are the means ± SDs from three biological replicates.

