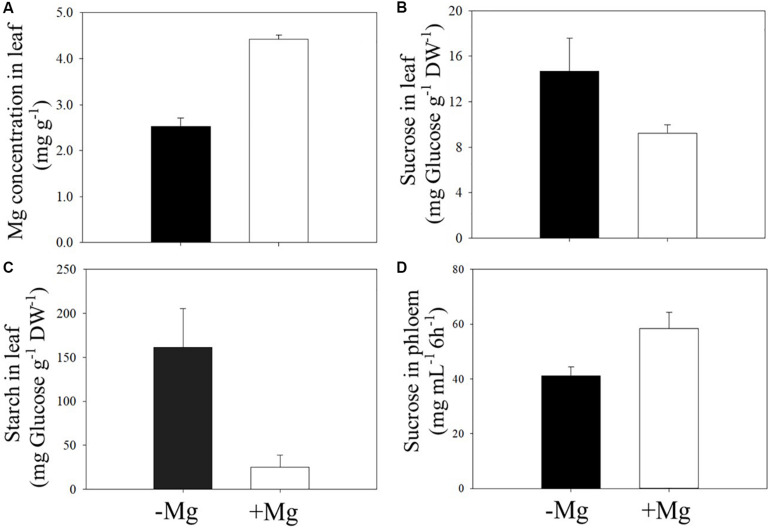
FIGURE 5.
Effect of sufficient (+Mg; 90 kg ha–1 MgSO4 ⋅ H2O) and deficient supply of Mg (−Mg; no supply) on the concentrations of Mg (A), sucrose (B), and starch (C) measured in the first leaf above the fruit. Same leaves were also used for measurement of sucrose in phloem exudates (D) at beginning of fruit formation stage in 2017 spring season. Vertical bars represent the mean ± SE of four independent replicates.

