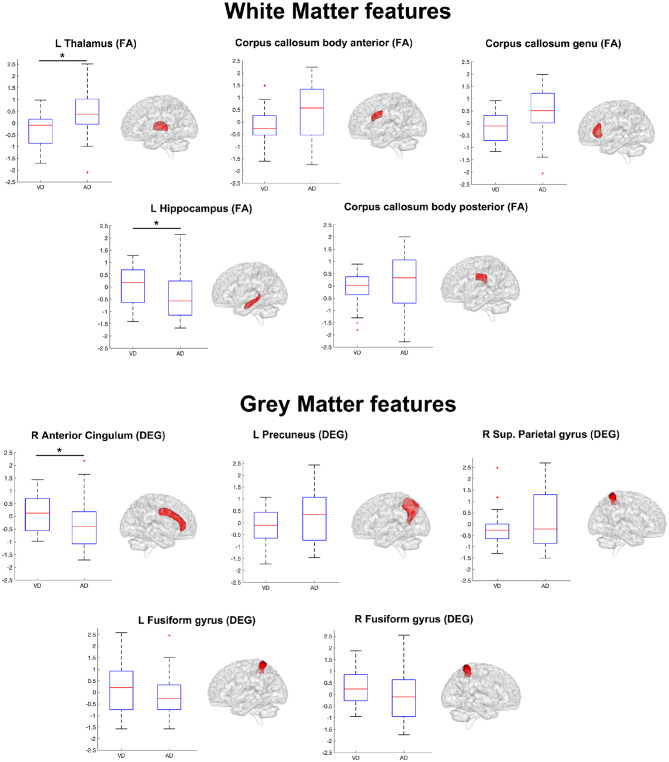
Figure 4.
Boxplots representing the summary of the 10 features (WM features on top, GM features on bottom) in AD and VD groups. The ensemble of these features (see also Table 4) formed the discriminant pattern that was also used to predict the prevalent underlying disease in MXD subjects. Each feature has been tested with the Mann–Whitney U test in order to assess significant differences between AD and VD values. An asterisk mark has been added on the top of the boxplot of the features with values significantly (p < 0.05) different between the AD and VD populations.

