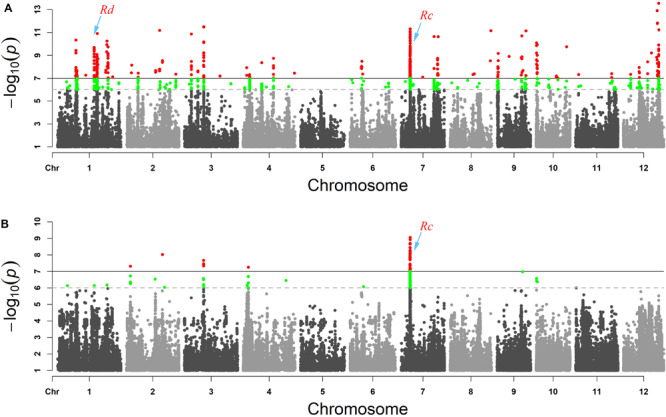
FIGURE 2.

GWAS results presented as Manhattan plot for (A) red pericarp weedy rice and (set 1) (B) red pericarp cultivated rice (set 2). The red area in the Manhattan map is the response site associated with red pericarp. The known pericarp color genes Rd and Rc are labeled.
