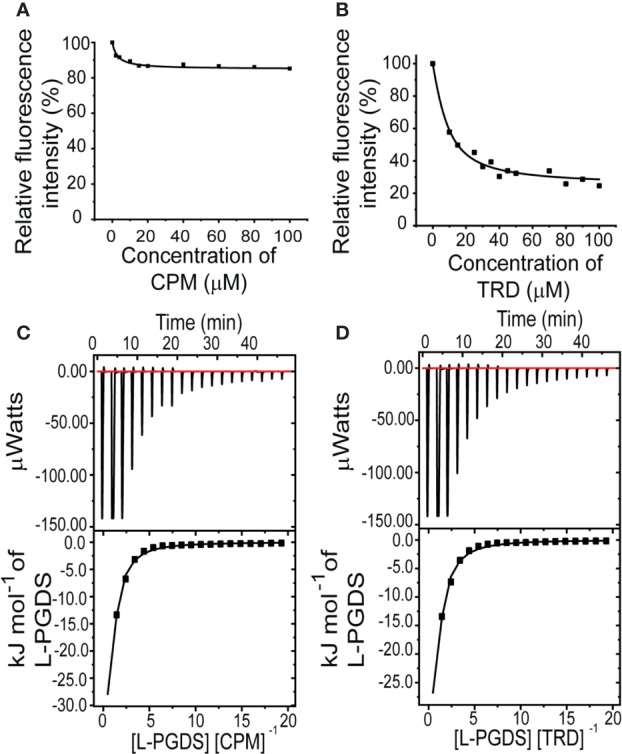
Figure 1.

Interactions between L-PGDS and the two drugs—CPM and TRD. Tryptophan fluorescence quenching of L-PGDS monitored at 340 nm is plotted against the various concentrations of CPM (A), TRD (B). About 2 µM of L-PGDS in 50 mM sodium phosphate buffer pH 7.0 was used. Thermodynamic analysis of L-PGDS binding to CPM (C) and TRD (D) in 50 mM sodium phosphate buffer pH 7.0 by ITC. L-PGDS was reversely titrated to 2 µM of CPM and 2 µM of TRD. The top panes show thermograms and binding isotherms. The bottom panels show the change in heat obtained.
