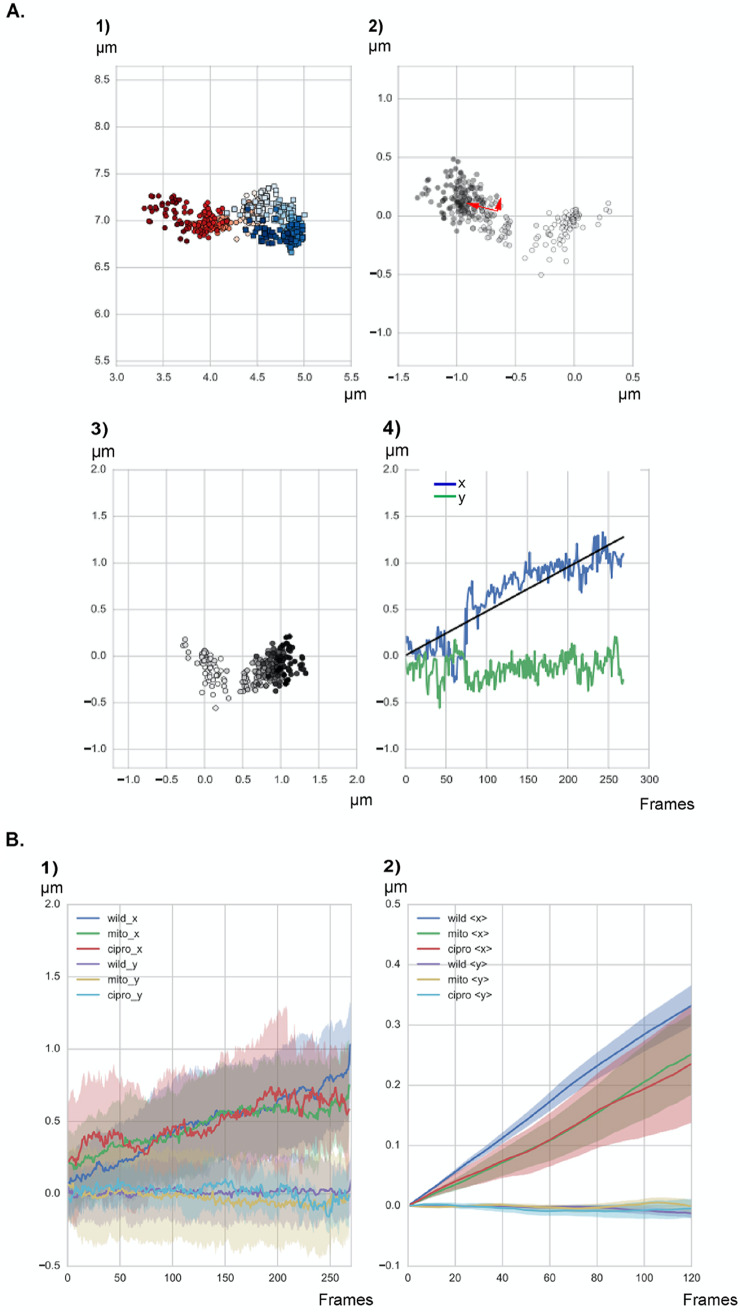
FIG 2.
Graphs describing the separation of two origins in a representative cell. (1) Position in the cell of all the points in the tracks. The first origin is shown in red, the second in blue. Colors go gradually from bright to dark along time. (2) Increasing distance between the two origins; darker dots reflect the distances in later time points, the same shading convention as in subpanel 1. The red arrows indicate a set of orthogonal vectors pointing along the short and long axis of the cloud of points. (3) Projection of the distances in subpanel 2 on a horizontal cell 2 μm in length, coordinate system with x parallel to the long, along the length of the cell, and y perpendicular to x, along the width of the cell. (4) Distance between the origins along the x and y axes versus time (1 frame = 10 s). The black straight line is a trend line for linear separation in time along the x direction. (B) Movement over time for all tracks generated under all three different conditions. Shown are results for exponentially growing cells (wild; n = 80 segregation events, from five independent biological replicates), cells treated with 50 ng/ml of mitomycin C (mito; n = 65 segregation events from three biological replicates), and cells treated with 125 ng/ml of ciprofloxacin (cipro; n = 62 segregation events from three biological replicates). “x” and “y” indicate movement along the long axis (“x”) or the width (“y”) of the cells. (1) Distance between the origins along the x and y axes versus time. (2) Distance moved in all tracks along the x and y axes at every time lag Ʈ shown in frames. In panel B, solid lines reflect averages of all graphs for every condition.

