FIG 3.
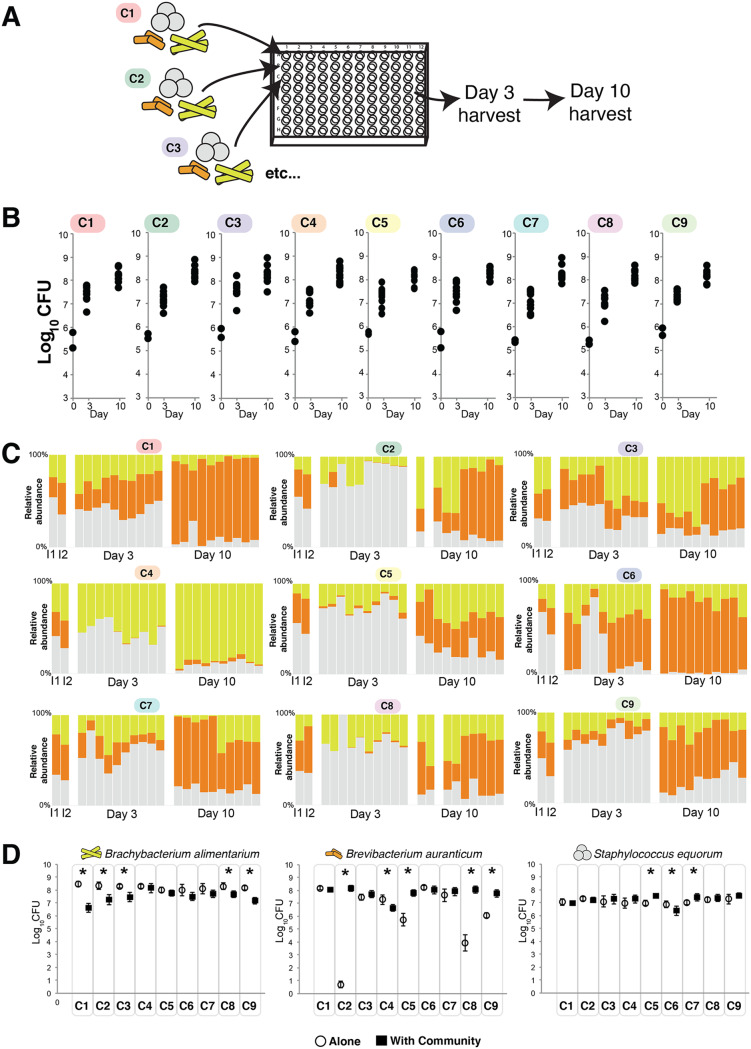
Divergent community assembly across nine synthetic cheese rind communities with identical species compositions. (A) Experimental setup. Each set of three species from each microbiome was inoculated into wells of 96-well plates. Communities were harvested 3 and 10 days after inoculation. (B) Total community abundance as measured by CFU of each of the nine microbiomes. n = 5 across two experimental replicates. For the day 0 inputs, only two points are shown to represent the inputs for each of the two experimental replicates. (C) Relative abundance of each of the three bacterial species across each of the nine microbiomes. Each column represents a replicate. I1 and I2 indicate the input compositions for the two independent experimental replicates. In the day 3 and day 10 data sets, the first five columns are from one experimental replicate and the second five are from a second experimental replicate. Blank columns represent replicates that were lost due to contamination. (D) Growth of each of the community members alone (open circles) and in the presence of the community (closed black squares). Each point represents the mean CFU of the taxa, and the error bars represent 1 standard deviation of the mean. Asterisks indicate significant differences between growth alone and growth in the community (n = 5, t test, P < 0.05).

