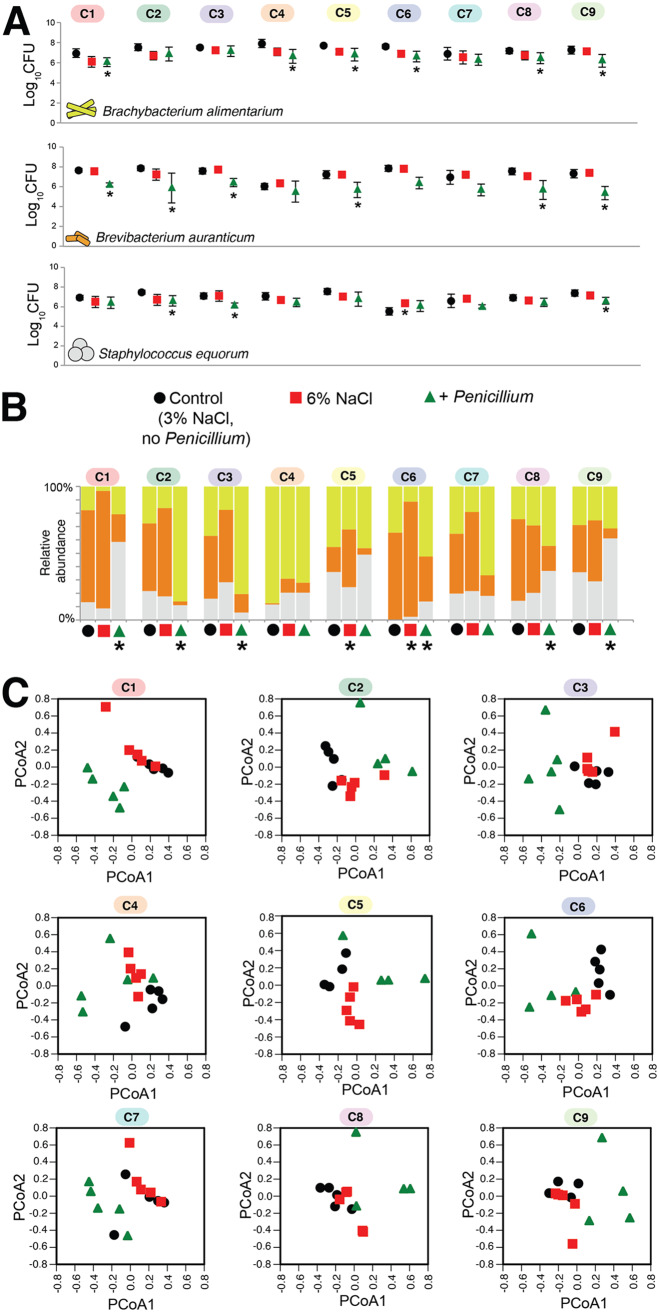
FIG 4.
Response of the nine synthetic cheese rind communities to abiotic and biotic perturbations. (A) Responses of each taxon to abiotic (6% salt) and biotic (Penicillium) disturbance. Each point represents the mean CFU of the taxa in that community at day 10 (n = 5), and the error bars represent 1 standard deviation of the mean. Asterisks indicate significant difference in growth compared to control based on the Kruskal-Wallis test (P < 0.05). (B) Mean community composition in the three treatments. An asterisk indicates significant difference in community composition compared to control based on PERMANOVA. (C) Principal-coordinate analysis (PCoA) of replicate communities in the three treatments. PCoA data are based on Bray-Curtis dissimilarity of absolute abundances of each community member.

