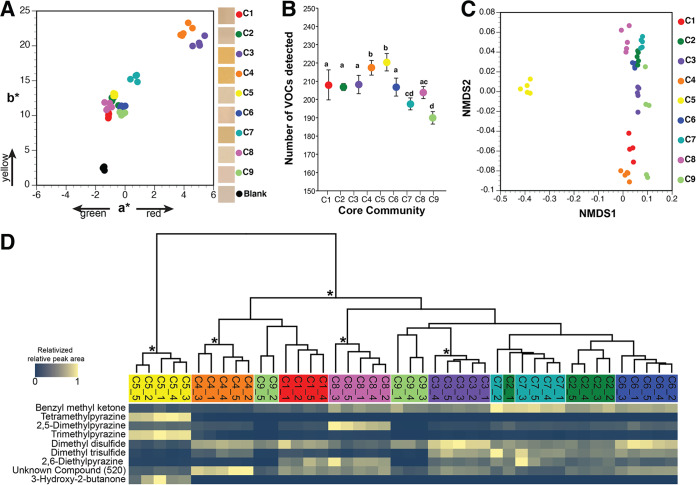
FIG 5.
Functional diversity across nine synthetic cheese rind communities. (A) Color profiles of experimental rind communities after 10 days of rind development. Each dot represents a replicate cheese rind community (n = 5). Boxes in the legend show representative photos of the synthetic rind community surface from each community. (B) Total volatile organic compound (VOC) diversity across the nine cheese communities. Each point represents the mean number of VOCs detected in each community, and the error bars represent 1 standard deviation of the mean (n = 5). Communities that share the same letter are not significantly different from one another based on the Kruskal-Wallis test (P < 0.05). (C) Nonmetric multidimensional scaling of total VOC profiles. Each dot represents a replicate cheese rind community (n = 5). (D) Relative abundances of VOCs that contributed the most to the Bray-Curtis dissimilarity across communities (as determined by SIMPER analysis). Because total concentrations of VOCs are highly variable across different compounds, visualization was simplified by relativizing the relative peak area from GC-MS chromatograms within each VOC to the highest concentration detected for that VOC. Data are clustered together by total VOC profiles using a UPGMA tree. Asterisks indicate clusters with >70% bootstrap support. For a full overview of all compounds detected, see Table S4.

