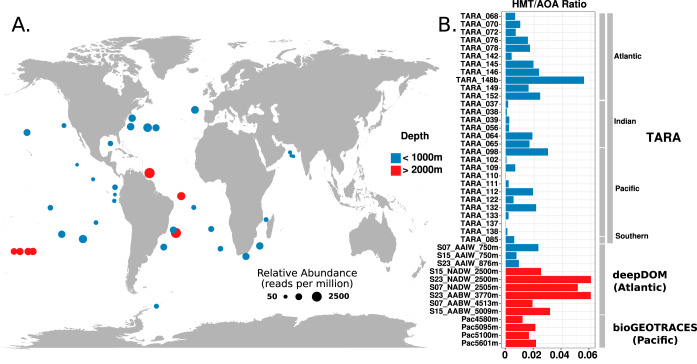
FIG 1.
(A) Relative abundance of the HMT lineage in metagenomic data collected from across the global ocean at depths ranging from 250 to 1,000 m (blue) and >2,000 m (red). HMT relative abundances were calculated by mapping metagenomic reads against a nonredundant set of HMT proteins and are presented in units of reads per million. (B) Relative abundances of HMT versus AOA in different metagenomic samples. Values are the ratio of HMT to AOA, calculated by mapping reads to single-copy marker genes (see Materials and Methods for details). Bars in red denote metagenomic samples taken at depths of >2,000 m, while blue bars denote depths of <1,000 m.

