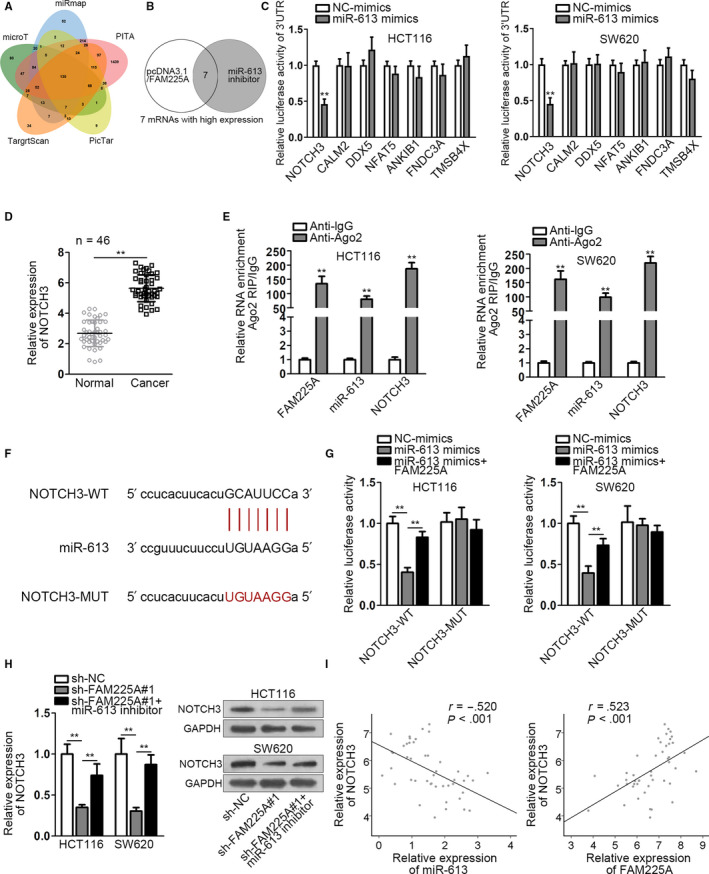
FIGURE 4.

FAM225A modulates NOTCH3 expression by binding to miR‐613. A, Venn diagram was plotted to show the common mRNAs predicted by five bioinformatics tools (miRmap, TargetScan, microT, PITA, and PicTar). B, qRT‐PCR analysis of mRNA expressions. Relative qRT‐PCR results were provided in an additional file named as “Supplementary Table S1.” C, Applying luciferase reporter assay ascertained the target gene of miR‐613 among the candidate mRNAs. D, qRT‐PCR was adopted to assess NOTCH3 expression in cancer tissues and normal tissues. E. RIP assay verified that FAM225A, miR‐613, and NOTCH3 coexisted in RNA‐induced silencing complex (RISC). F, The binding sequences of miR‐613 and NOTCH3 were acquired from starBase website. G, Luciferase reporter assay was applied to attest the interaction relationship of miR‐613 and NOTCH3. H, NOTCH3 mRNA and protein levels were measured by qRT‐PCR and western blot analysis. I, Pearson correlation analysis of the relationship between miR‐613 and NOTCH3, as well as FAM225A and NOTCH3. All data were manifested as the mean ± SD. **P < .01, ***P < .001
