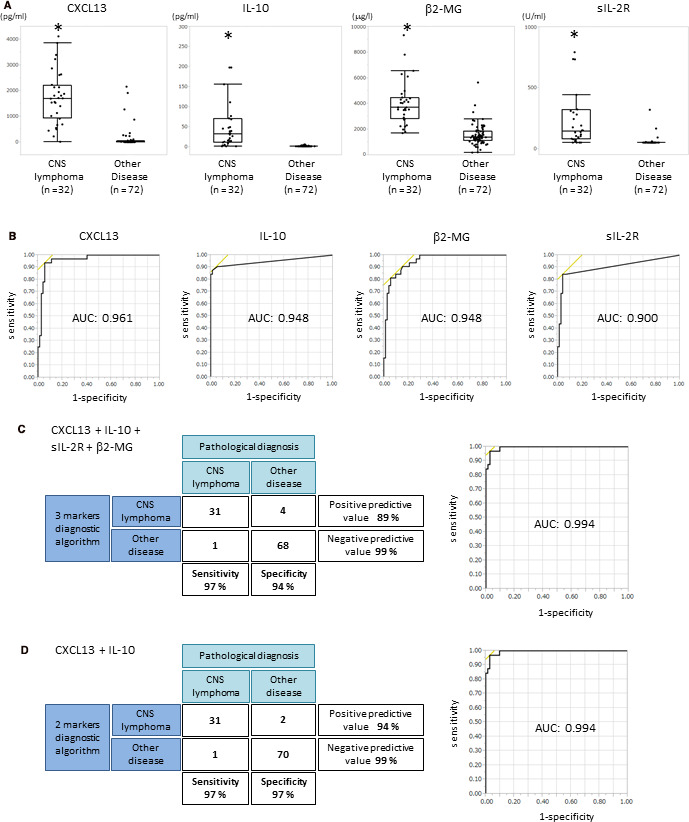
FIGURE 2.

A, A comparison of the cerebrospinal fluid (CSF) concentrations of CXCL13, IL‐10, sIL‐2R, and β2‐MG in the prospective study. Patient data are shown in Table S2. The CSF levels of all biomarkers significantly increased in CNS lymphoma compared with the other diseases (*P < .001). B, ROC curve of CSF CXCL13, IL‐10, sIL‐2R, and β2‐MG in the prospective study. ROC is statistically significant (P < .001). AUC values are shown in each graph. C, Correlation of diagnosis by the 4‐marker algorithm of CXCL13, IL‐10, sIL‐2R, and β2‐MG with pathological diagnosis in the prospective study. Sensitivity, specificity, positive predictive value, and negative predictive value are shown in the panels. The ROC curve of these combinations in the prospective study is shown in the right panel. D, Correlation of diagnosis by the 2‐marker algorithm of CXCL13 and IL‐10 with pathological diagnosis in the prospective study. Sensitivity, specificity, positive predictive value, and negative predictive value are shown in the panels. The ROC curve of these combinations in the prospective study is shown in the right panel
