
FIGURE 3.
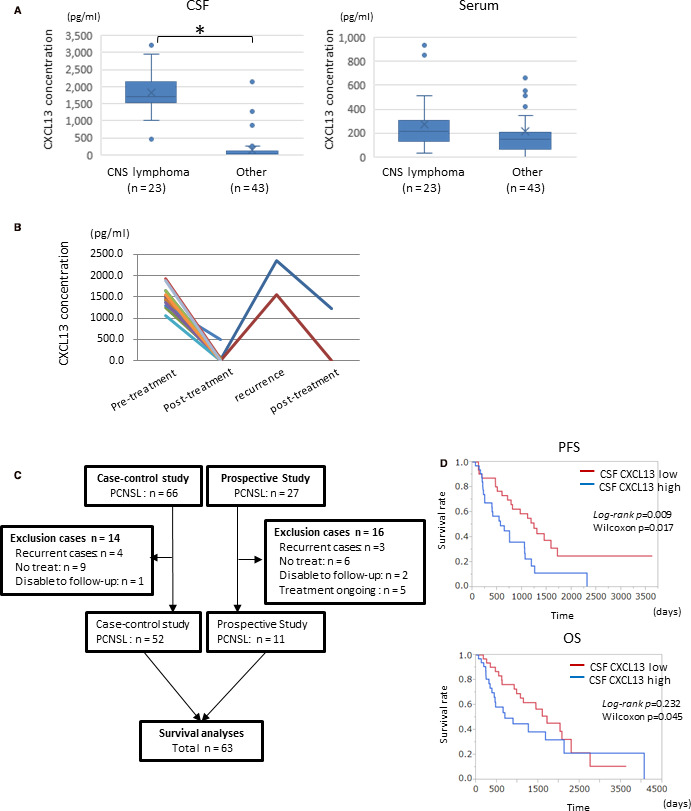
A, Comparison of the serum or cerebrospinal fluid (CSF) levels of CXCL13 between CNS lymphoma and the other CNS diseases. B, Changes in the CSF CXCL13 concentration in the disease process. At recurrence, CSF CXCL13 levels increased again. C, A flow chart of the PCNSL patient selection in the survival analysis. D, Comparison of Kaplan‐Meier PFS (left panel) and OS (right panel) curves according to the concentrations of CSF CXCL13 (high > 1500 pg/mL, low < 1500 pg/mL; p: log‐rank and Wilcoxon analysis)