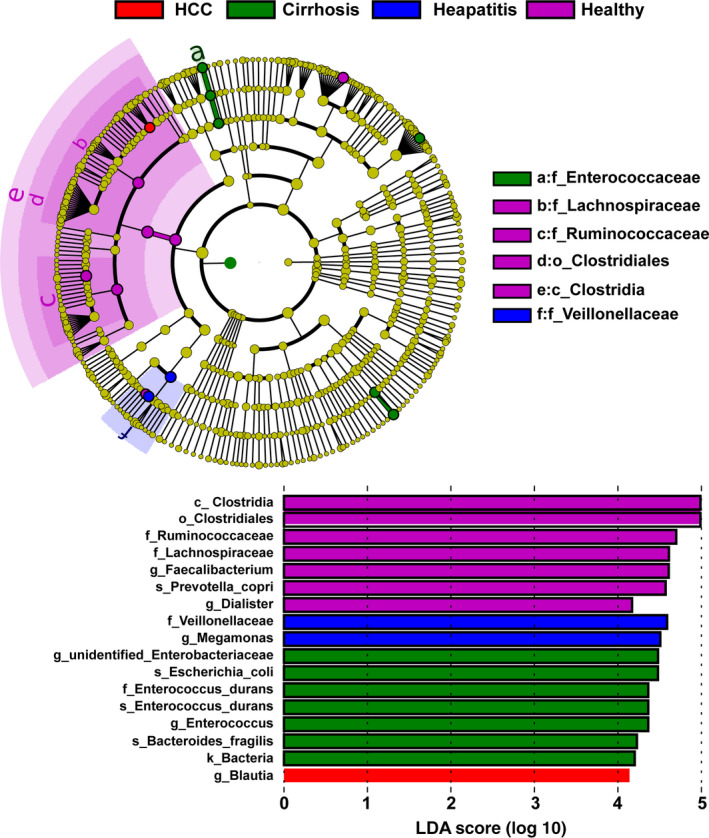
Figure 5.

LEfSe analysis among the healthy, hepatitis, LC, and HCC groups. The differentially abundant taxa in the taxonomic tree are shown in the cladogram in different colors. The LDA scores greater than 4.0 for the significantly differentially abundant bacteria are displayed in the histogram with different colors. LC, liver cirrhosis; HCC, hepatocellular carcinoma; LEfSe, linear discriminant effect size. LDA, linear discriminant analysis
