
Figure 10.
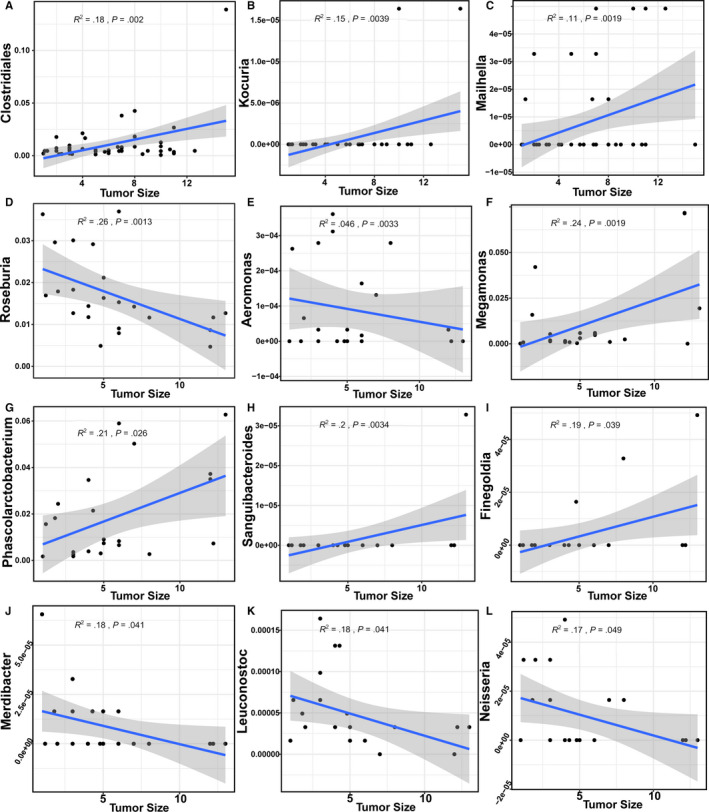
The genera in LC‐HCC and NLC‐HCC, that were correlated with tumor size. A‐C, The genera identified in LC‐HCC. D‐L, The genera identified in NLC‐HCC. The confidence interval was P < .05 and R 2 > .1. LC, liver cirrhosis; HCC, hepatocellular carcinoma; LC‐HCC, liver cirrhosis‐induced HCC; NLC‐HCC, nonliver cirrhosis‐induced HCC