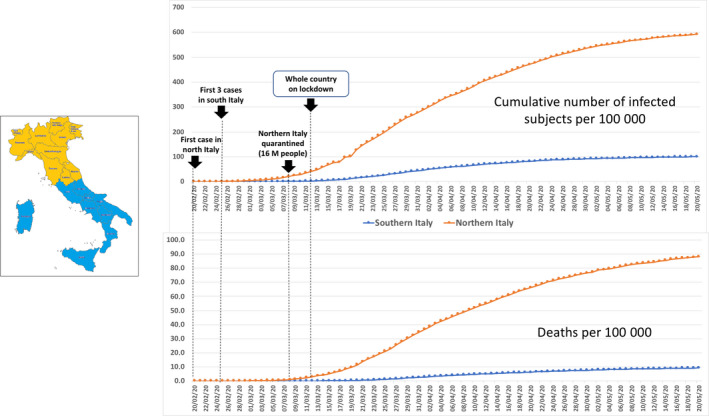
Figure 1.

The upper graph shows the cumulative number of COVID‐19‐infected patients in Italy from 20 February to 20 May 2020. The lower graph shows the time progression in the absolute number of deaths. 2 Dots and lines indicate the incidence of cases per 100 000 residents in southern and northern Italian regions
