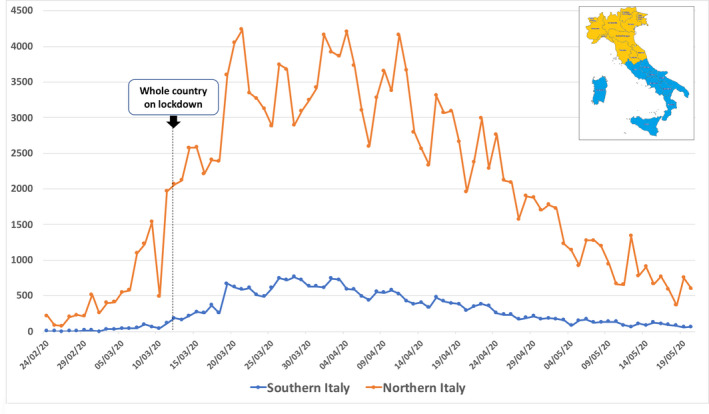
Figure 2.

Time changes in the absolute daily number of new cases of infection in northern and southern Italy from 24 February to 20 May 2020. 2 Data show a progressive increase before the lockdown and a plateau with a following decrease about 2 wk after
