FIGURE 1.

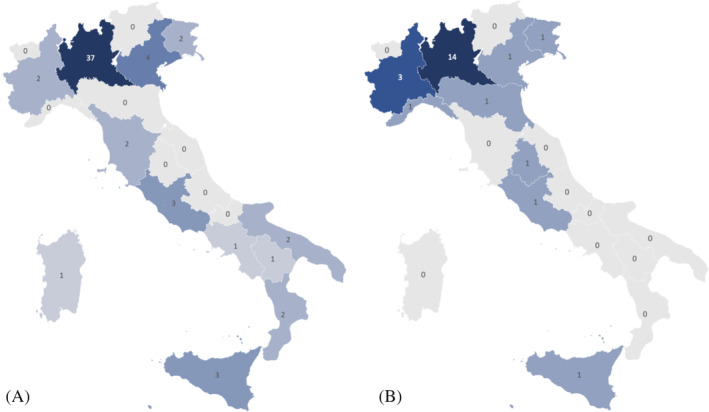
Graphic representation showing patients' geographic origin during the two periods considered. A, CONTROL‐group and B, PANDEMIC‐group [Color figure can be viewed at wileyonlinelibrary.com]

Graphic representation showing patients' geographic origin during the two periods considered. A, CONTROL‐group and B, PANDEMIC‐group [Color figure can be viewed at wileyonlinelibrary.com]