
FIGURE 4.
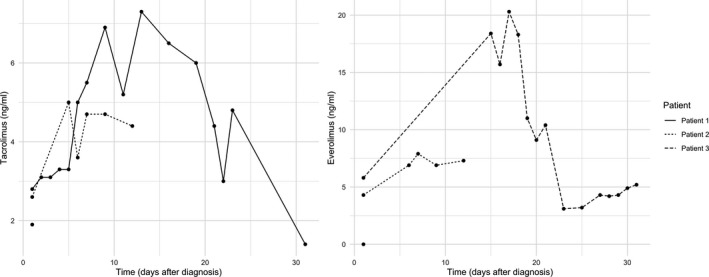
Line plots depicting trough levels of tacrolimus and everolimus. First values represent last available values before COVID‐19 diagnosis
Official websites use .gov
A
.gov website belongs to an official
government organization in the United States.
Secure .gov websites use HTTPS
A lock (
) or https:// means you've safely
connected to the .gov website. Share sensitive
information only on official, secure websites.
Line plots depicting trough levels of tacrolimus and everolimus. First values represent last available values before COVID‐19 diagnosis