Figure 1.

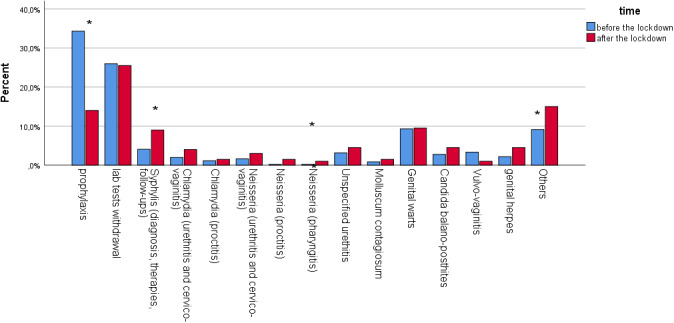
Frequency distribution of the type of service delivered in the two time periods: before and after the lockdown. (Asterisks denote significant differences).

Frequency distribution of the type of service delivered in the two time periods: before and after the lockdown. (Asterisks denote significant differences).