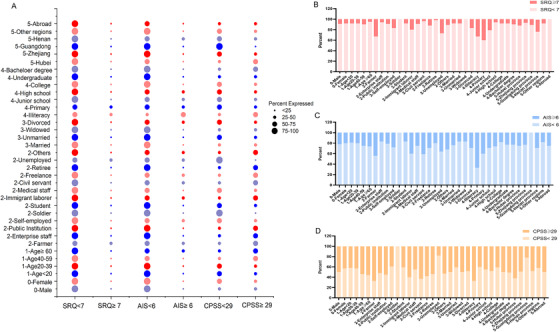
FIGURE 1.

Distribution of different populations above and below the critical value of different scales. A, The scores of different populations and different scales were compared. The size of the bubble represents the proportion of different people in a scale. B, The scores of different populations and the Self‐Report Questionnaire‐20 Scale (SRQ‐20) were compared. C, The scores of different populations and the Athens Insomnia Scale (AIS) were compared. D, The scores of different populations and the Chinese version of the Perceived Stress Scale (CPSS) were compared
