
Figure 2.
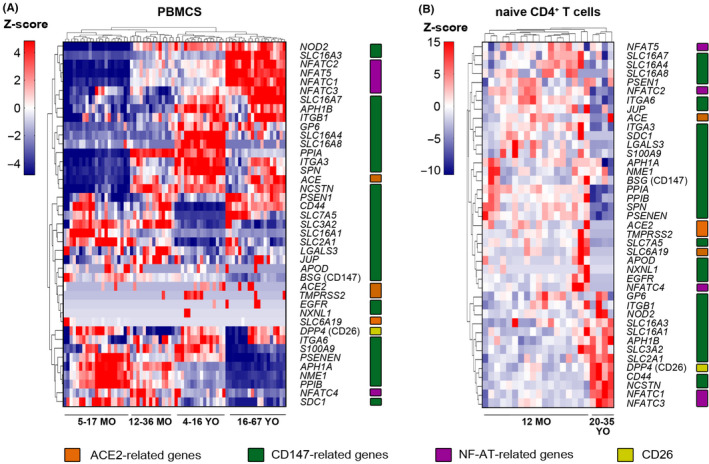
Distinct expression profile of ACE2‐, CD147‐, and CD26‐related genes in PBMCs and T cells of children and adults. A) Expression of ACE2‐, CD147‐, NFAT‐, and CD‐26‐related genes in the human PBMCs in healthy children aged 5‐17 months (n = 21), 12‐36 month (n = 14), 4‐16 years (n = 16) and healthy adults aged 16‐67 years (n = 19). B) Expression of ACE2‐, CD147‐, NFAT‐, and CD‐26‐related genes in the human naïve CD4+ T cells from 12 months old healthy children (n = 18) and 20‐35 years old healthy adults (n = 4). All heatmaps display normalized gene expression across the groups (rows normalization). Color‐coding represents gene families related to ACE2 (orange), CD147 (green), NF‐ATs (purple) and CD26 (yellow). MO, months old; YO, years old; PBMCs, peripheral blood mononuclear cells