
Figure 1.
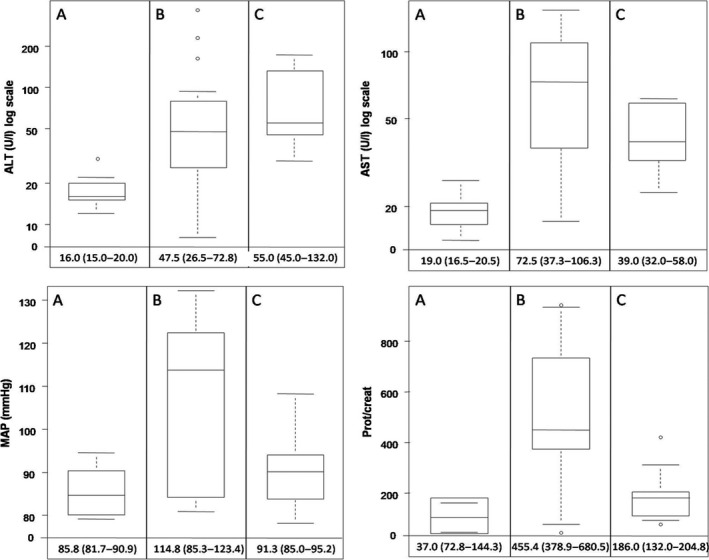
Evolution of ALT, AST, proteinuria and mean arterial blood pressure in pregnant women with COVID‐19 before (A), during (B) and after (C) severe pneumonia. The bottom and top edges of each box represent the first and third quartiles, respectively, the band within the box represents the median value and the whiskers represent values that are 1.5 times the interquartile range. Median values and interquartile range of each variable are displayed.