Figure 3.

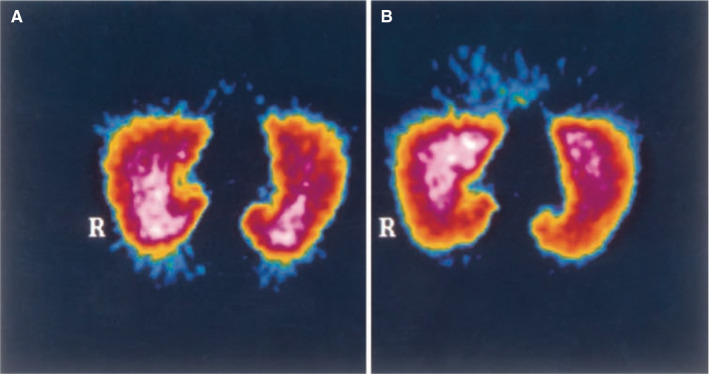
(from Rimeika et al). 29 Single photon emission computed tomography image of pulmonary perfusion in one supine volunteer before (A) and after (B) NOS inhibition using L‐NMMA intravenously. R indicates the right lung

(from Rimeika et al). 29 Single photon emission computed tomography image of pulmonary perfusion in one supine volunteer before (A) and after (B) NOS inhibition using L‐NMMA intravenously. R indicates the right lung