
Figure 1.
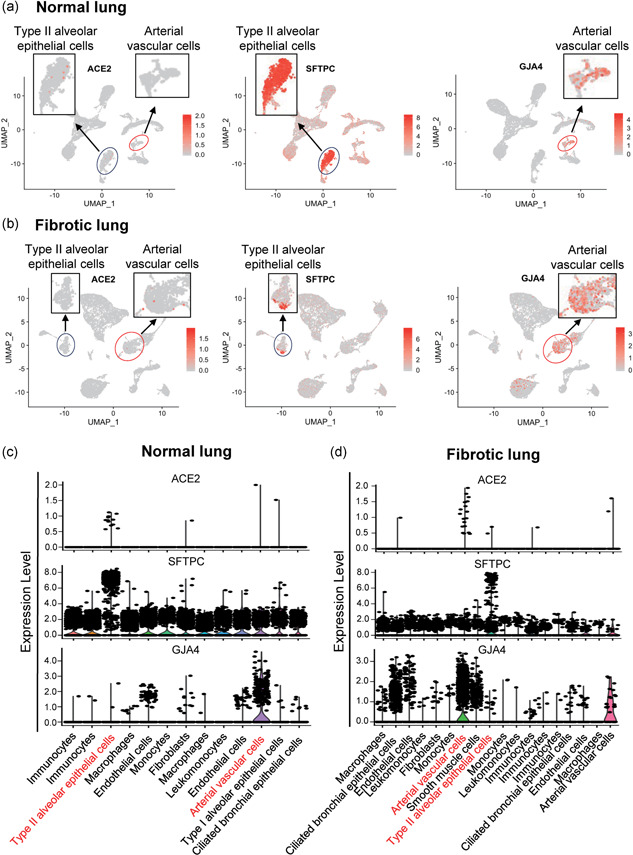
Different distribution pattern of angiotensin converting enzyme II (ACE2)‐expressing cells in normal and fibrotic lungs. (a and b) Feature plot showing the distribution of ACE2, SFTPC, and GJA4 expression levels in normal lungs (a) and in fibrotic lungs (b). (c and d) Violin plot showing the distribution of ACE2, SFTPC, and GJA4 expression levels in normal lungs (c) and in fibrotic lungs (d)