
Figure 3.
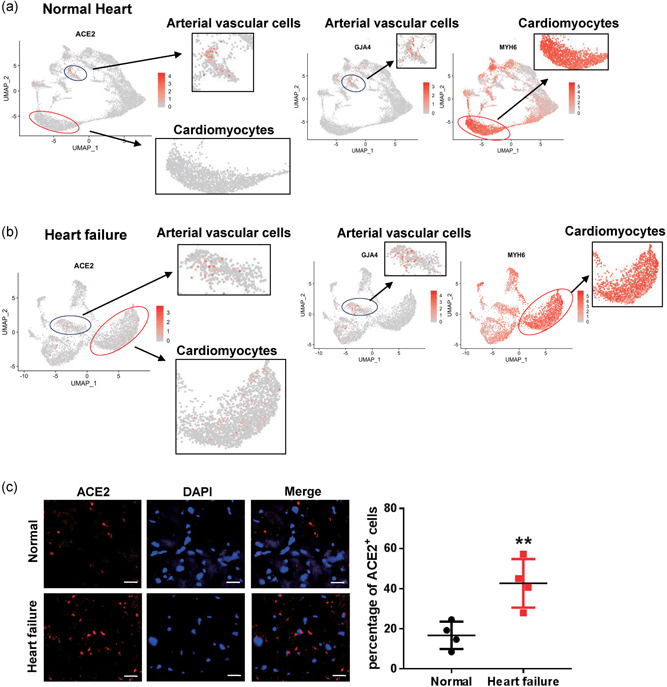
Different distribution of angiotensin converting enzyme II (ACE2)‐expressing cells in normal and failed hearts. (a,b) Feature plot showing the distribution of ACE2, GJA4, and MYH6 expression levels in normal hearts (a) and in failed hearts (b). (c) Immunofluorescence staining of ACE2 (red) expression and DAPI, 4',6‐diamidino‐2‐phenylindole (DAPI) (blue) in normal hearts, and in failed hearts. Scale bar = 20 μm (n = 4). Significance is determined with a two‐tailed unpaired Student's t test, **p < .01