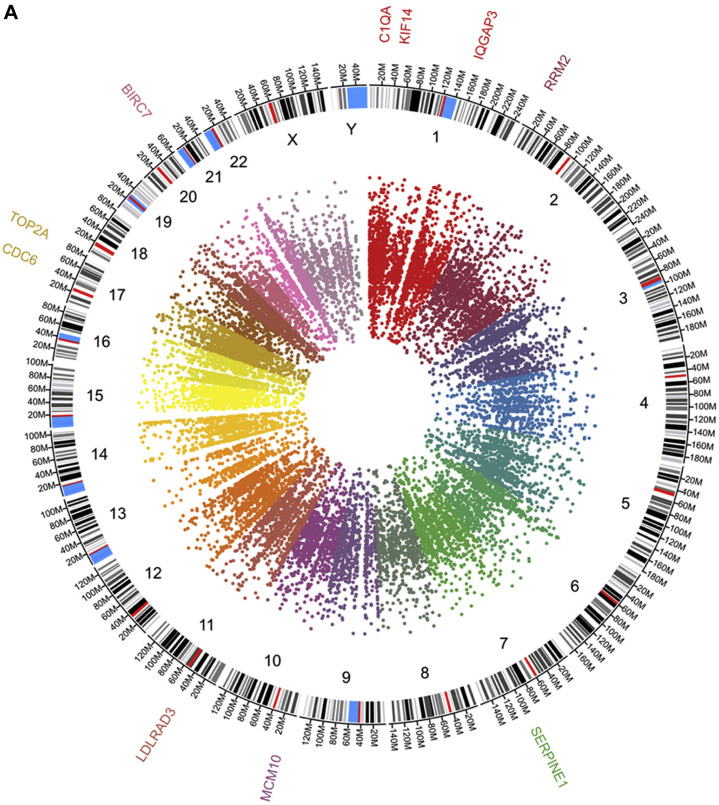
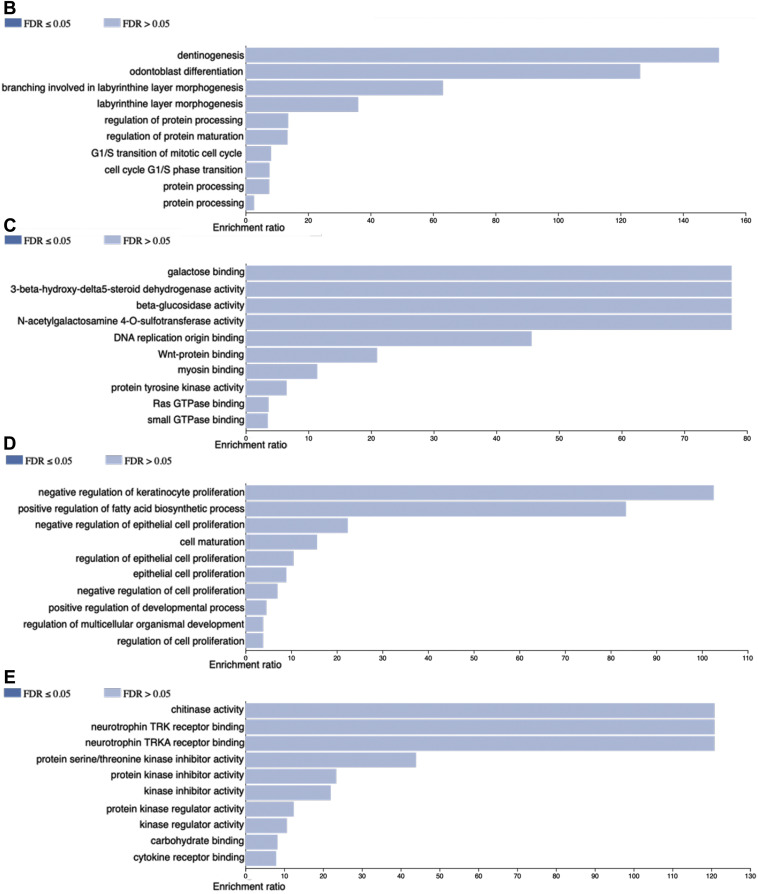
Figure 3.
Panel A depict circos plot from the peripheral blood mononuclear cells transcriptome from COVID-19 patients. Inner ring is the scatter plot representing each transcript identified followed by chromosome number and size, the outer ring present genes identified participating in G1/S transition of mitotic cell cycle and protein processing. B and C panels show Gene Ontology at biological process and molecular function terms, respectively, from top 100 up-regulated genes. D and E panels show Gene Ontology at biological process and molecular function terms, respectively, from top 100 down-regulated genes.


