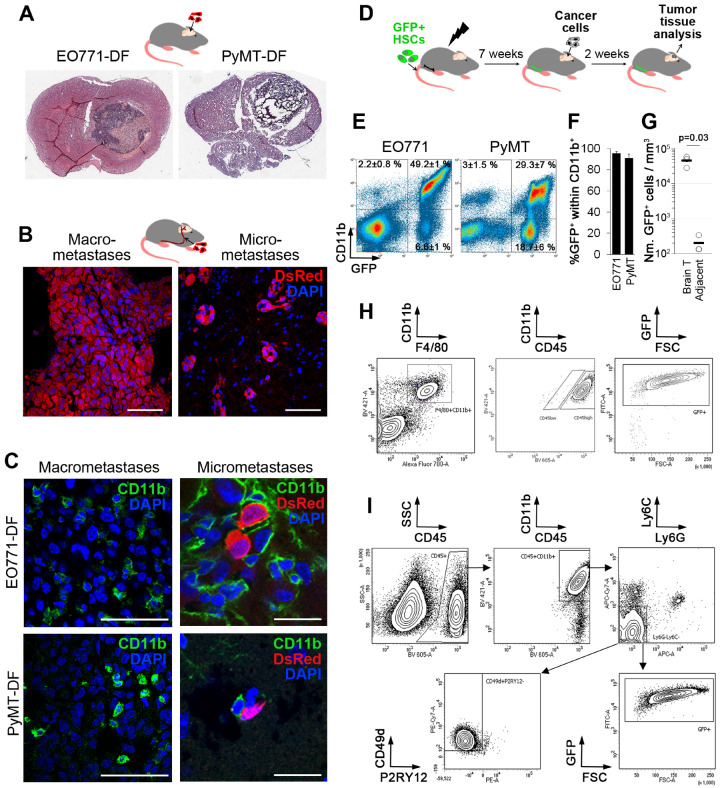
Figure 1.
Myeloid cells in preclinical models of brain metastases. A) Discosoma sp. red fluorescent protein/Fluc (DF)–tagged EO771 and PyMT breast cancer cells give rise to a single large cancer lesion in the brain following intracranial implantation (H&E staining); n = 4. B) Administration of EO771-DF cancer cells into the internal carotid artery gives rise to micro- and macrometastases 2 weeks post-injection (n = 3/6 for EO771-DF/PyMT-DF). Scale bar = 50 µm. C) Macrometastases (intracranial implantation model) and micrometastases (carotid artery model) in the brain are infiltrated by CD11b+ myeloid cells (group sizes as in A and B). Scale bars = 50 µm (left panels) and 20 µm (right panels). D–F) Bone marrow in C57Bl/6J mice was ablated by irradiation, followed by transplantation of hematopoietic stem cells (HSCs) isolated from the transgenic mice expressing green fluorescent protein (GFP) downstream of the Ubiquitin C (UBC) promoter. Seven weeks later, tumors were generated by intracranial implantation of cancer cells. Infiltration of GFP+ bone marrow–derived myeloid cells (CD11b+) was quantified by flow cytometry at 2 weeks post–cancer cell injection (E). Percentage of GFP+ cells within the CD11b+ cell population is shown in (F); n = 5. G) Quantification of GFP+ HSC progeny per mm3 tissue within PyMT brain tumors and normal tumor-adjacent brain tissue (n = 3, P = .03. Statistically significant difference was determined with the two-tailed Student’s t test. H) Representative dot plots of flow cytometry for quantifying the percentage of CD45high cells within CD11b+F4/80+ population and percentage of GFP+ cells within CD11b+F4/80+CD45high cell population infiltrating PyMT tumors (n = 3). I) Gating strategy and quantification of GFP+ and CD49d+P2RY12- cells within CD45+CD11b+Ly6C-Ly6G- microglia/macrophages infiltrating PyMT tumors (n = 3).

