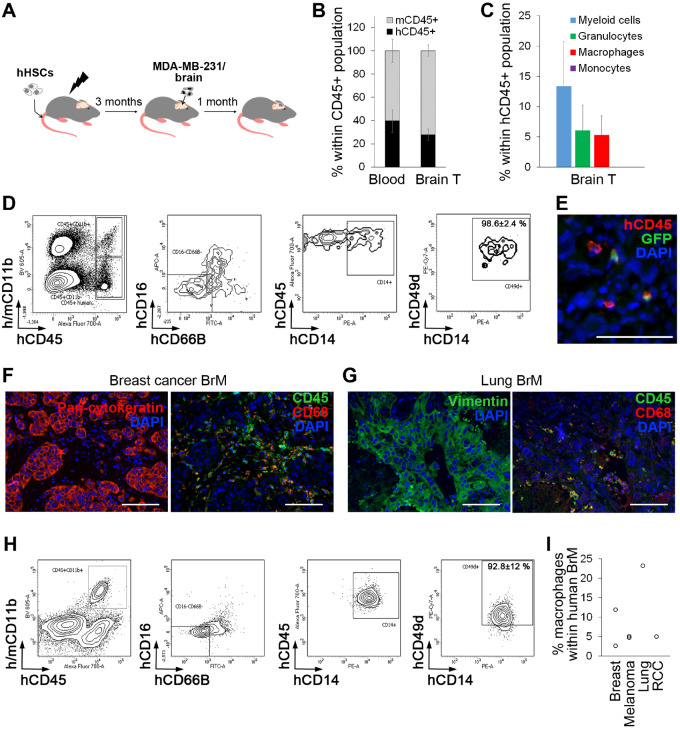
Figure 3.
Human hematopoietic stem cells (HSCs) and their progeny as cellular vehicles targeting brain metastases. A) Tumors were generated in humanized NSG mice (JAX) 3–4 months after engraftment of human HSCs (hHSCs) by intracranial implantation of MDA-MB-231/brain cells. B) The percentage of human hematopoietic cells (hCD45+) in blood and brain tumors was quantified by flow cytometry (n = 3). C) Myeloid cell subpopulations within MDA-MB-231/brain tumors were quantified by flow cytometry (n = 3). D) Percentage of CD49d+ macrophages within human CD45+CD11b+CD16-CD66B-CD14+ population in intracranial MDA-MB-231/brain tumors was quantified by flow cytometry (n = 3). Representative dot plots are shown. E) Lentiviral pFUGW vector–transduced hHSCs were transplanted into sublethally irradiated NSG mice, and tumors were generated by intracranial implantation of MDA-MB-231/brain cells 3–4 months later (n = 4). Detection of green fluorescent protein-positive human hematopoietic cells in intracranial tumors was performed by immunofluorescence. Scale bar = 50 µm. F, G) Hematopoietic cells and macrophages in patient brain metastases specimens originating from breast cancer (F) and lung cancer (G) were detected by immunofluorescence (n = 3 per cancer type). To visualize cancer cells, adjacent sections were stained for pan-cytokeratin (breast cancer brain metastases [BrM]) or vimentin (lung cancer BrM) and costained for human CD45 (hematopoietic cells) human CD68 (macrophages). Scale bars = 100 µm. H) Percentage of CD49d+ macrophages within CD45+CD11b+CD16-CD66B-CD14+ microglia/macrophage population (25) in patient BrM originating from different primary cancer types as indicated in (I) was quantified by flow cytometry (n = 6). Representative dot plots are shown. I) Percentage of CD45+CD11b+CD16-CD66B-CD14+CD49d+ macrophages within total cell population in patient BrM (n = 6). RCC = renal cell carcinoma.

