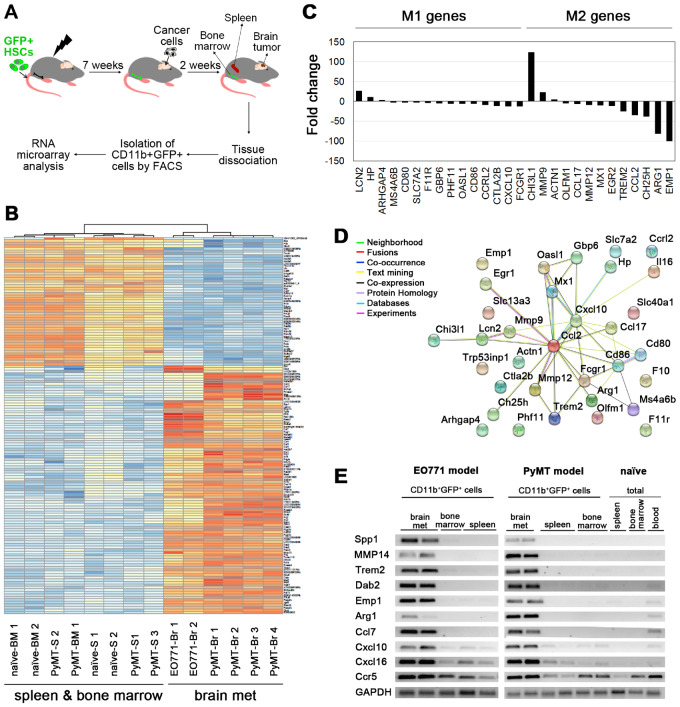
Figure 4.
Identification of genes specific for brain metastases-infiltrating myeloid cells. A) Tumors in the brain were generated by intracranial implantation of cancer cells (untagged) into chimeric mice with green fluorescent protein (GFP)-tagged bone marrow (derived from Ubiquitin C [UBC]: GFP mice). CD11b+GFP+ cells were isolated from the brain tumors, spleens, and the bone marrow and subjected to RNA microarray analysis. Spleens and bone marrow isolated from naïve mice were used instead of those isolated from EO771 brain metastases (BrM)-bearing mice. B) A heat map of the top 150 probes differentially expressed between bone marrow-derived myeloid cells (CD11b+GFP+) isolated from BrM (Br) and myeloid cells isolated from the spleen (S) bone marrow (BM); n = 4 for PyMT BrM and the spleens; n = 1 for the PyMT bone marrow; n = 2 for EO771 BrM, naïve spleens, and naïve bone marrow. C) Differential expression of macrophage polarization–associated genes between BrM- and the spleen/bone marrow–derived myeloid cells. D) Functional protein interaction network of 33 murine macrophage polarization-associated genes, as identified using Search Tool for the Retrieval of Interacting Genes (STRING) (33). Individual nodes represent genes connected by color-coded lines of interaction according to software predictions (confidence score set to 0.4). E) Expression of top 10 genes upregulated in myeloid cells within brain metastases was validated by semiquantitative polymerase chain reaction. GADPH was used as a control. Representative DNA gels are shown. The quantification of the data is shown in Supplementary Figure S4B (available online). HSC = hematopoietic stem cell.

