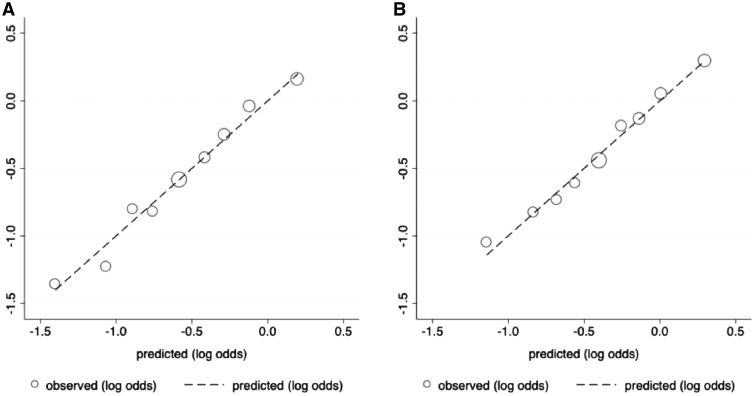
Figure 2.
Calibration of two polygenic risk scores (PRS) containing 180 and 71 single nucleotide polymorphisms (SNPs), respectively. Calibration plots for (A) the 180-SNP PRS in seven datasets, excluding City of Hope/ Clinical Cancer Genetics Community Research Network, n = 12 280, and (B) the 71-SNP PRS (B) in all datasets n = 13 624. The graph depicts the predicted vs observed proportions of cases within each decile of the log-normalized PRS. Each circle corresponds to a decile of the PRS, with the middle (largest) circle representing the 40–60th percentile. Two-sided Hosmer-Lemeshow P value = .32 for 180-SNP PRS and .68 for 71-SNP PRS.

