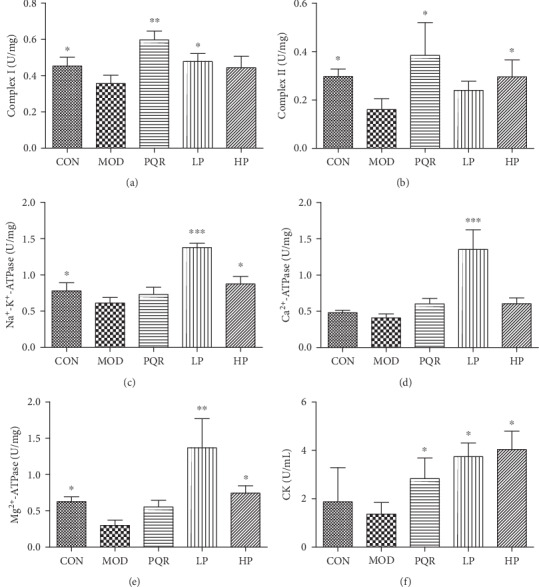
Figure 4.

Effects of the prescription on energy metabolism in mice. Mice were administered saline, PQR, or the prescription extract (1 or 2 g/kg/day). After 4 weeks of feeding, mice were sacrificed and serum and hind-leg skeletal muscle tissue were collected. Levels of (a) complex I, (b) complex II, (c) Na+-K+-ATPase, (d) Ca2+-ATPase and (e) Mg2+-ATPase in the mitochondria of skeletal muscle, and (f) CK in the serum were determined using commercial kits. Values represent the mean ± S.D. from 7 animals. ∗P < 0.05, ∗∗P < 0.01, and ∗∗∗P < 0.001 versus the relative MOD group. ATPase: ATP synthase; CK: creatine kinase; CON: control; HP: high-dose prescription; LP: low-dose prescription; MOD: model; PQR: Panacis Quinquefolii Radix.
