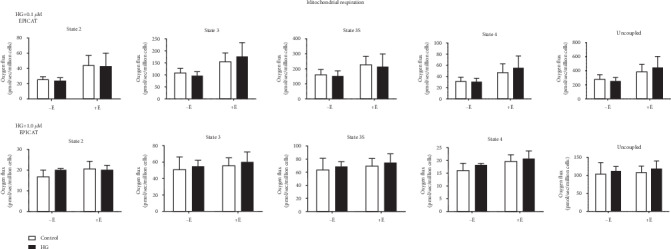
Figure 2.

Mitochondrial respiration of permeabilized cells. Permeabilized HUVECs were exposed to substrates and inhibitors mimicking carbohydrate metabolism and states 2 (leak state), 3, 3S (both ATP-generating respiration), 4 (leak state), and uncoupled were determined. Respiration rates normalized to cell count (n = 4). ∗p < 0.05, †p < 0.08, interaction, treatment, or EPICAT effect, two-way ANOVA, Bonferroni's multiple comparisons analysis. Data are expressed as mean ± SEM.
