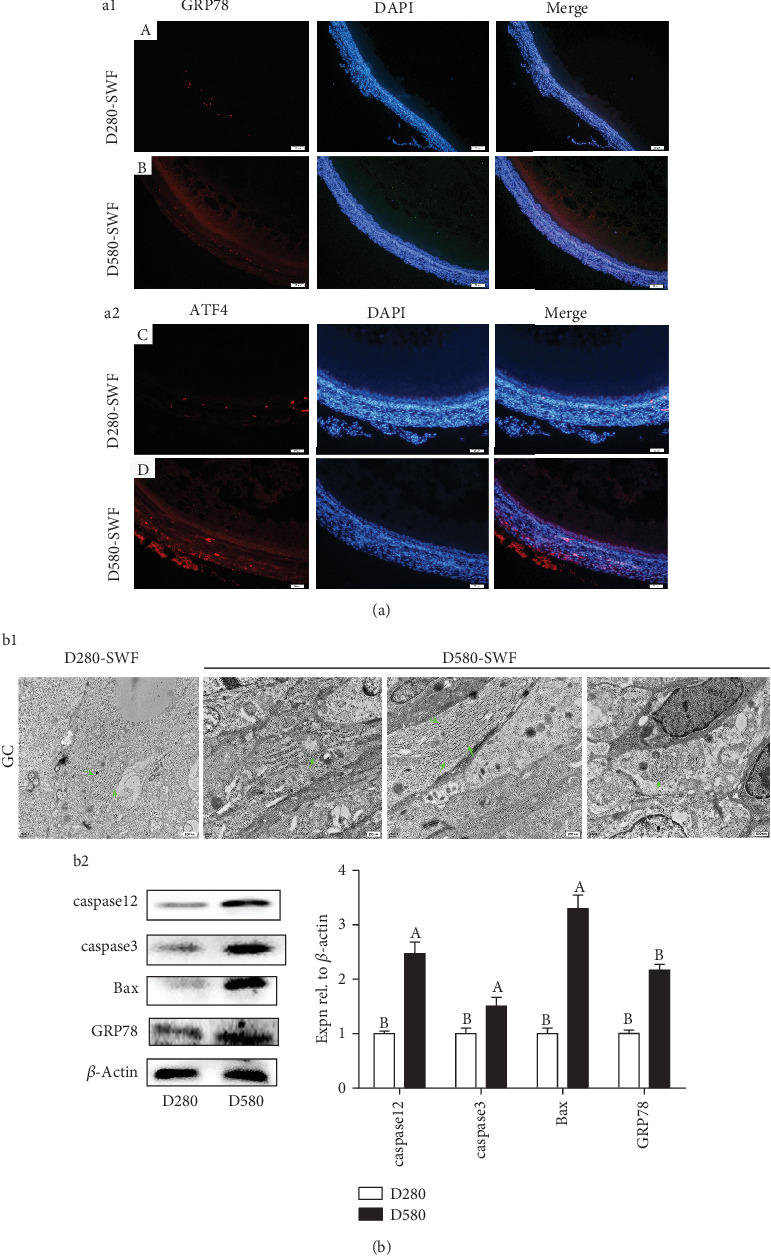
Figure 2.

Age-related ER stress in SWFs of the D280 and D580 hens. IF staining was used to observe the localization of GRP78 ((a1) A and B) and ATF4 ((a2) C and D) in SWFs of hens, and red fluorescence was used to mark GRP78 and ATF4. Scale bar: 50 μm. TEM was used to observe the ER morphology (b1) of the SWFs, and green arrows pointed to the ER. Western blot and grey analysis of caspase3, caspase12, Bax, and GRP78 (b2) expression in SWFs. Values were the mean ± SEM of three experiments. Different lowercase letters indicated significant difference (p < 0.05).
