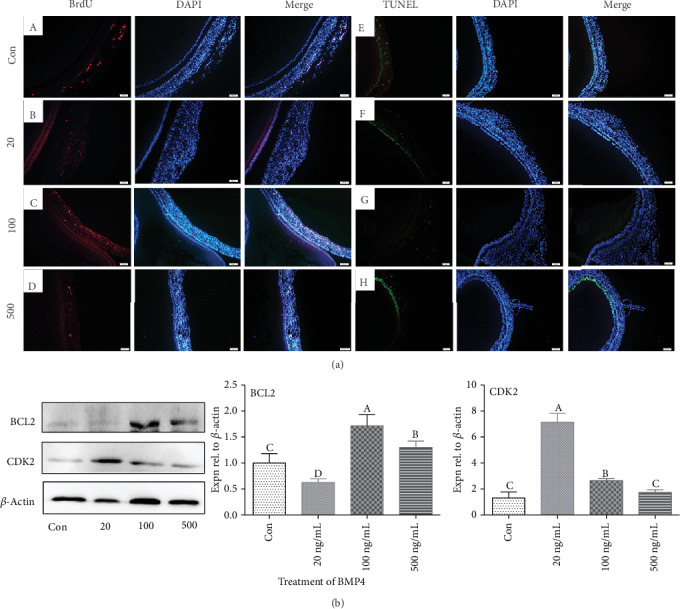
Figure 5.

Determination of the optimal concentration of BMP4 for treatment in culture. The SWFs were incubated with BrdU. Red fluorescence represents BrdU-labeling cells ((a) A–D). Blue fluorescence represents the DAPI staining. Changes in the TUNEL index ((a) E–H) in D580-SWFs after treatment with BMP4 (20-500 ng/mL). Scale bar: 50 μm. Western blot and grey analysis (b) of CDK2 and BCL2. Values were the mean ± SEM of three experiments. Different lowercase letters indicated significant difference (p < 0.05).
