-
A
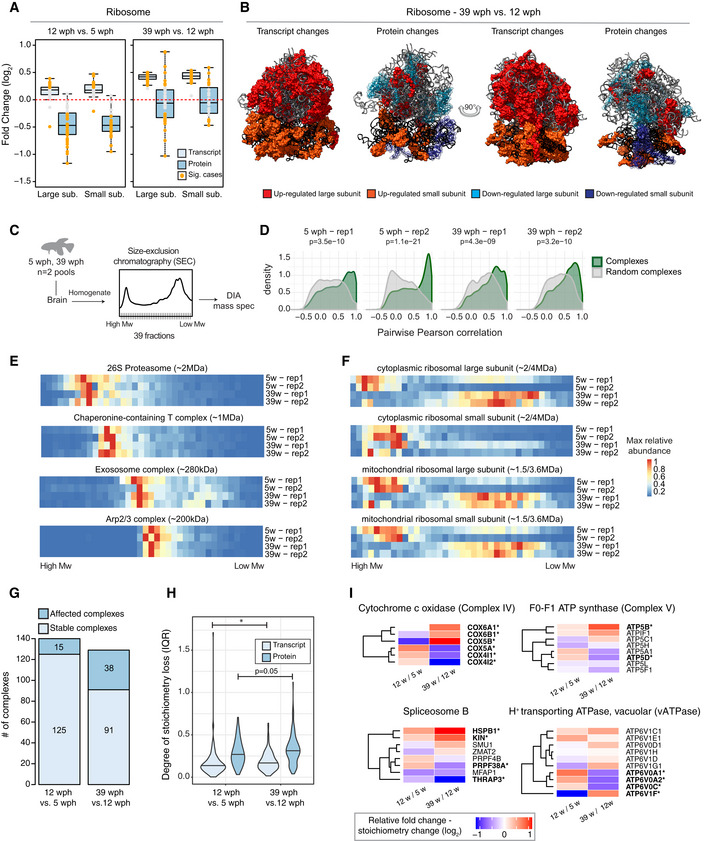
Abundance changes of ribosomal proteins and their transcripts during aging. Cytoplasmic ribosomal proteins of large and small subunits are displayed separately, and changes are shown for both the age comparisons as boxplots. Transcripts are displayed as light blue and proteins as dark blue boxes. Changes of individual proteins are displayed as dots; orange dots identify significant cases (adj. P < 0.05, n = 4 per age group for proteome and n = 5 per age group for transcriptome). In boxplots, the horizontal line represents the median, the bottom and top of the box the 25th and 75th percentile, respectively, and the whiskers extend 1.5‐fold the interquartile range.
-
B
Visualization of age‐related changes of proteins and transcripts projected on the 80S ribosome complex structure. Ribosomal RNAs are depicted in ribbon form: 28S rRNA, 5S rRNA, and 5.8S rRNA of large subunit are depicted in light gray, and 18S rRNA of small subunit is depicted in black. Ribosomal proteins are depicted as molecular surfaces and shown only if significant changes in the level of corresponding mRNA or protein were detected. Affected proteins of large and small subunits are visualized in two different shades of red (up‐regulated), or blue (down‐regulated). For clarity, down‐regulated components are displayed as transparent molecular surfaces. Visualization was performed with USCF Chimera (version 1.12), according to Protein Data Bank archive— human 80S ribosome 3D model: 4UG0.
-
C
Brains from young (5 wph) and old (39 wph) were homogenized and clarified lysates separated by size‐exclusion chromatography (SEC). For each age group, two pools of brains were processed separately. For each experiment (four in total), 39 fractions were collected along the chromatogram, digested into peptides, and analyzed by data independent acquisition (DIA) quantitative mass spectrometry.
-
D
Co‐elution of members of protein complexes in SEC. For each experiment, the distribution of pairwise correlations between members of the same protein complex was analyzed (green). As expected, members of protein complexes tend to co‐elute in all SEC experiments, as indicated by positive correlation values. A set of randomly defined protein complexes was used as control (gray). For all the experiments, the correlations of real complexes are significantly higher than random ones, Wilcoxon rank‐sum test.
-
E, F
Co‐elution profiles for selected protein complexes. For each complex, the median abundance of all the quantified subunits was used to generate the complex profile across fractions (
Dataset EV5). All the complex profiles are scaled to the max value (set to 1) to make profiles comparable across experiments. The estimated molecular weight of the displayed complexes is indicated in brackets.
-
G
Statistics of protein complexes undergoing stoichiometry changes with aging. Only protein complexes that had at least five members quantified were considered for each comparison. Complexes were considered affected if at least two members showed significant stoichiometry change (adj.
P < 0.05 and absolute log
2 fold change > 0.5). The complete list of stoichiometry changes is available in
Dataset EV6.
-
H
Violin plots depicting interquartile ranges (IQRs) of individual members of protein complexes during aging. The IQR for each protein complex considered in G was calculated using transcript (total RNA dataset, light blue) or protein (dark blue) log2 fold changes between two age groups (n = 4 per age group for proteome and n = 5 per age group for transcriptome). *P < 0.05, Wilcoxon rank‐sum test. The central line of the violin plots indicates the median value.
-
I
Heatmap showing relative protein fold changes for members of selected complexes affected by aging. Names of significantly affected members in the 39 vs 12 wph comparison (adj.
P < 0.05 and absolute log
2 fold change > 0.5) are highlighted in bold with a star. Data information: Related to Fig
EV3 and
[Link],
[Link].

