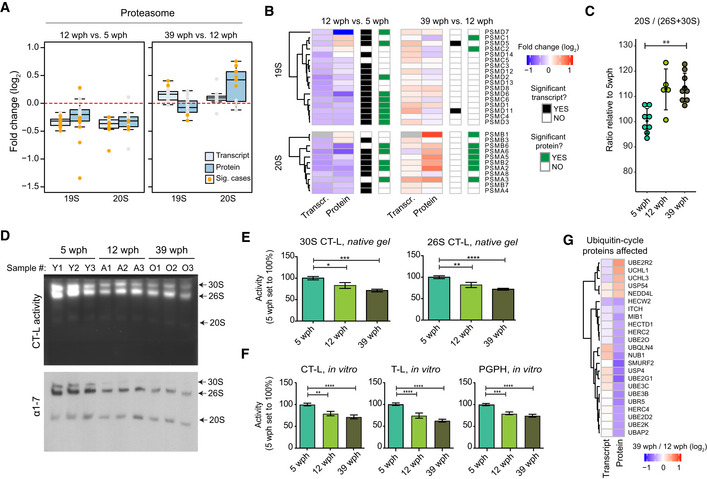
Abundance changes of proteasome proteins and their transcripts during aging. Members of the 19S and 20S complex are displayed separately, and changes are shown for both the age comparisons as boxplots. Transcripts are displayed as light blue and proteins as dark blue boxes. Changes of individual proteins are displayed as dots and orange dots represent significant cases (adj. P < 0.05, n = 4 per age group for proteome and n = 5 per age group for transcriptome). In boxplots, the horizontal line represents the median, the bottom, and top of the box the 25th and 75th percentile, respectively, and the whiskers extend 1.5‐fold the interquartile range.
Heatmap showing transcript and protein fold changes for members of the 26 proteasome (19S and 12S complexes). Genes are annotated according to significance of their changes at the level of transcript (adj. P < 0.05: black, adj. P > 0.05: white) or protein (adj. P < 0.05: green, adj. P > 0.05: white).
The between 20S and 26S + 30S proteasome abundance assessed by immunoblot on native gels (Fig
EV5A). **
P < 0.001, Wilcoxon rank‐sum test. The bars indicate mean ± SD.
In‐gel proteasome assay following native gel electrophoresis (top) and immunoblotting of proteasome complexes (30S, 26S and 20S; bottom) in young (5 wph), adult (12 wph), and old (39 wph) killifish brains. For additional samples and low exposure pictures, see Fig
EV5B and C.
Barplots depicting the quantification of chymotrypsin‐like (CT‐L) activity from native gels calculated for doubly capped (30S) or singly capped (26S) proteasomes. n ≥ 5 per sample group; error bars indicate standard error of the mean. *P < 0.05, **P < 0.005, ***P = 0.0001, ****P < 0.001, one‐way ANOVA, Holm–Sidak's multiple comparison test. For each sample group, the mean value of activity in young samples (5 wph) was set to 100%.
Percentage (%) of chymotrypsin‐like (CT‐L), trypsin‐like (T‐L), and peptidylglutamyl peptide hydrolyzing or caspase‐like (PGPH) proteasome activities in brain extracts of killifish of different ages. n ≥ 6 per sample group; error bars indicate standard error of the mean. **P < 0.005, ***P = 0.0001, ****P < 0.001, one‐way ANOVA, Holm–Sidak's multiple comparison test. For each sample group, the mean value of each activity in young samples (5 wph) was set to 100%.
Age‐related changes of proteins involved in the ubiquitin cycle. All the displayed proteins showed significant protein level changes in the 39 vs 12 wph comparison (adj. P < 0.05).
.

