
Figure 1.
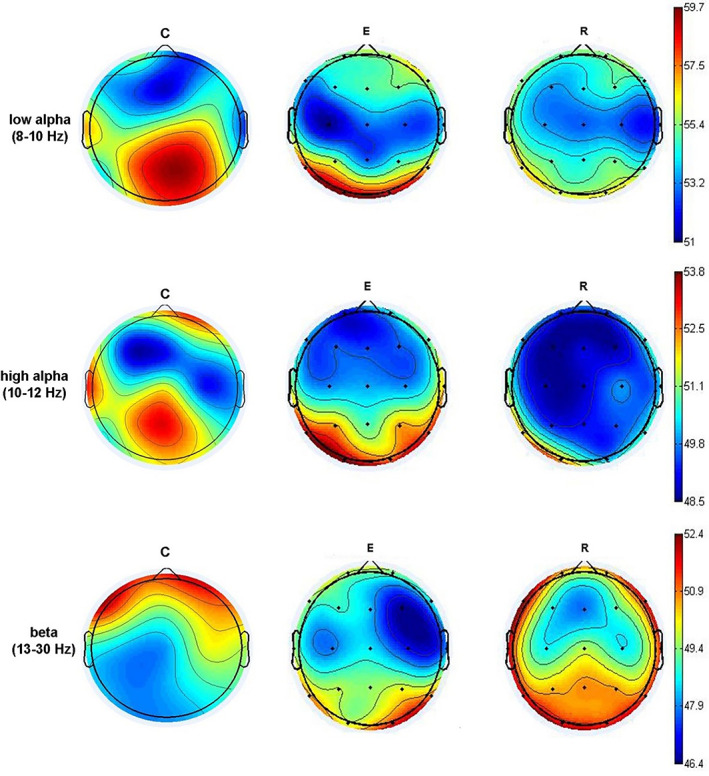
Spectral power maps are showing the difference between healthy persons (C) and those in the acute episode (E) and remission (R)
Official websites use .gov
A
.gov website belongs to an official
government organization in the United States.
Secure .gov websites use HTTPS
A lock (
) or https:// means you've safely
connected to the .gov website. Share sensitive
information only on official, secure websites.
Spectral power maps are showing the difference between healthy persons (C) and those in the acute episode (E) and remission (R)