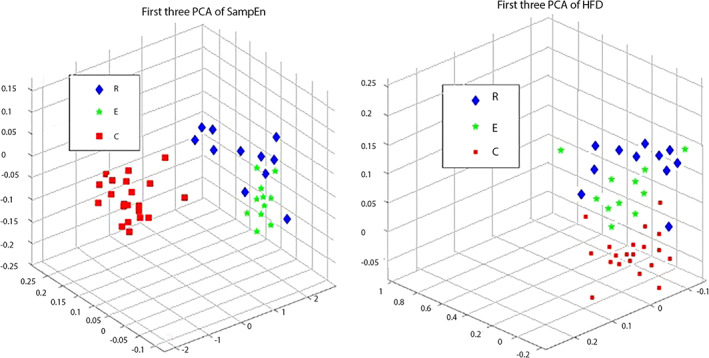
Figure 5.

Principal component analysis was used to show the separability of the data. We used only first three principal components. Blue diamonds are symbols for those who are diagnosed with depression and are in remission; green stars are depressed patients who are in exacerbation and red squares are representing control group. Panel left represents how separable are the values of SampEn calculated from EEG of subjects from these three groups; panel on the right represents the values of calculated. HFD, Higuchi's fractal dimension
