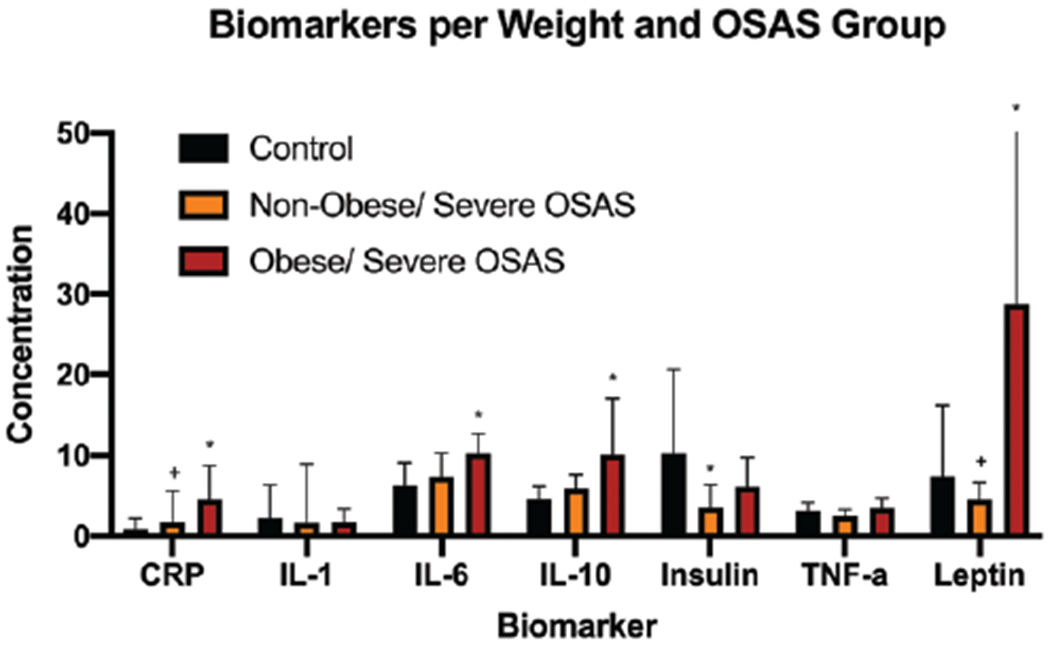
Figure 3.

Comparison of biomarker concentrations between normal-weight and obese patients with and without OSAS. *P < .05 versus nonobese/non-OSAS control group. +P < .05 versus obese/OSAS group. Units of measurement are as follows: CRP (μg/mL), IL-1β (pg/mL), IL-10 (pg/mL), insulin (μU/mL), leptin (ng/mL), TNF-α (pg/mL). Concentrations of IL-1, IL-6, and IL-10 were multiplied by 10 to optimize visual comparisons on the graph. CRP indicates C-reactive protein; IL, interleukin; OSAS, obstructive sleep apnea syndrome; TNF, tumor necrosis factor.
