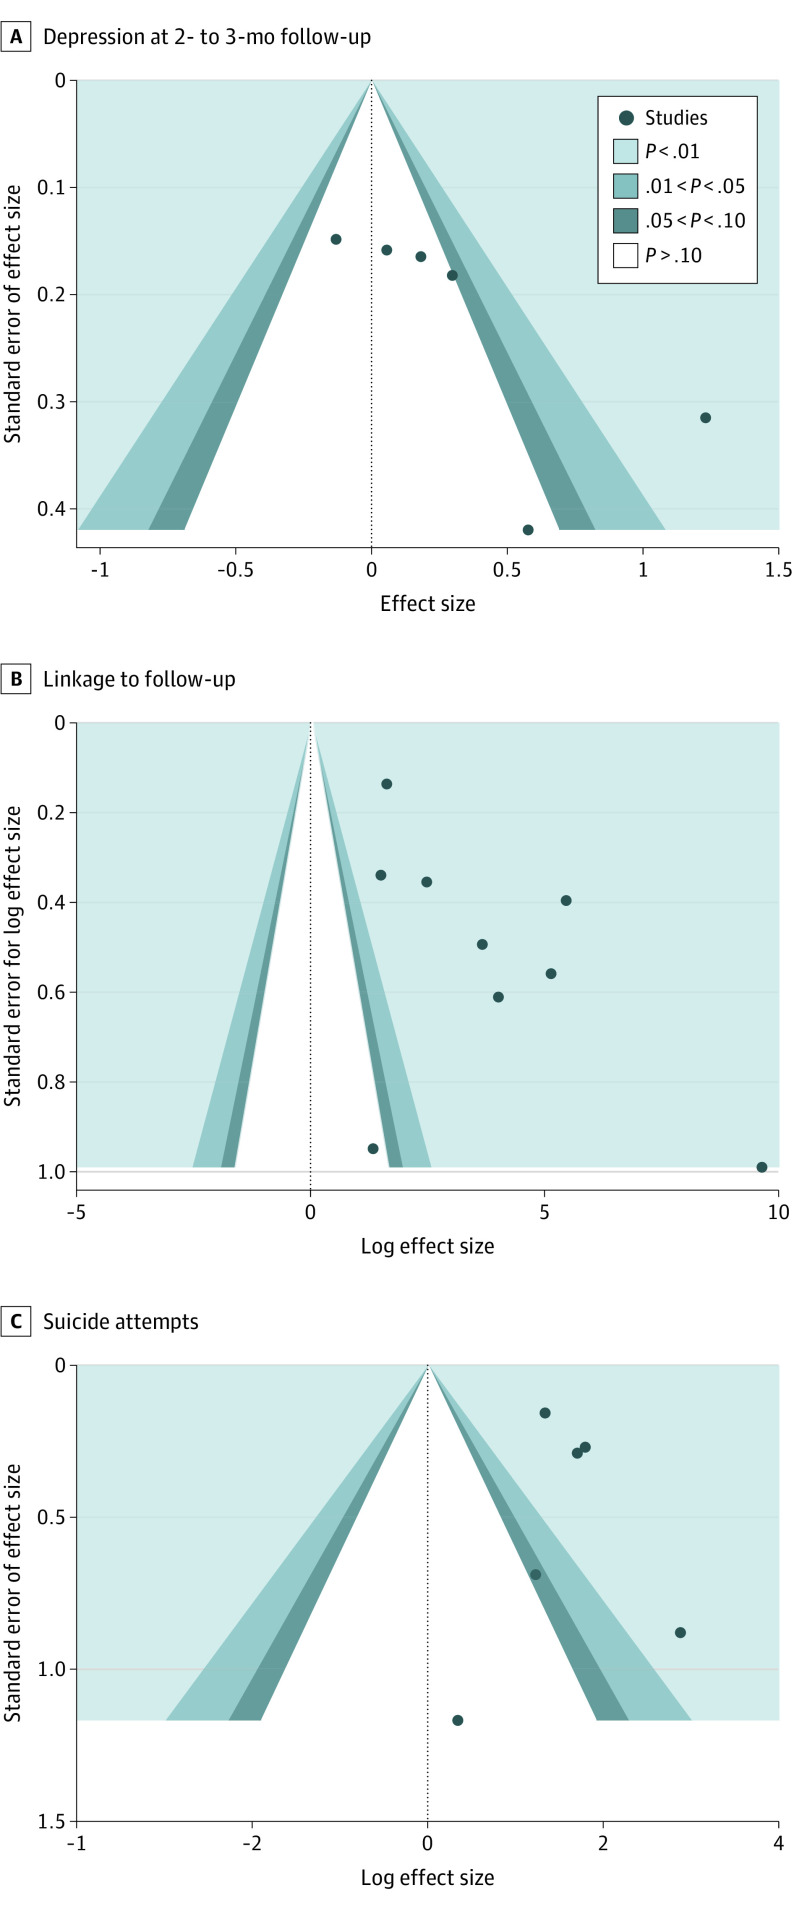
Figure 3. Contour-Enhanced Funnel Plots for 3 Study Outcomes: Depression, Linkage to Follow-up Care, and Subsequent Suicide Attempts.
The vertical axis shows the standard error of the natural logarithm of the effect size for each study, and the horizontal axis shows the natural logarithm of the effect size of each study. If no publication bias is present, dots are expected to be distributed symmetrically.

