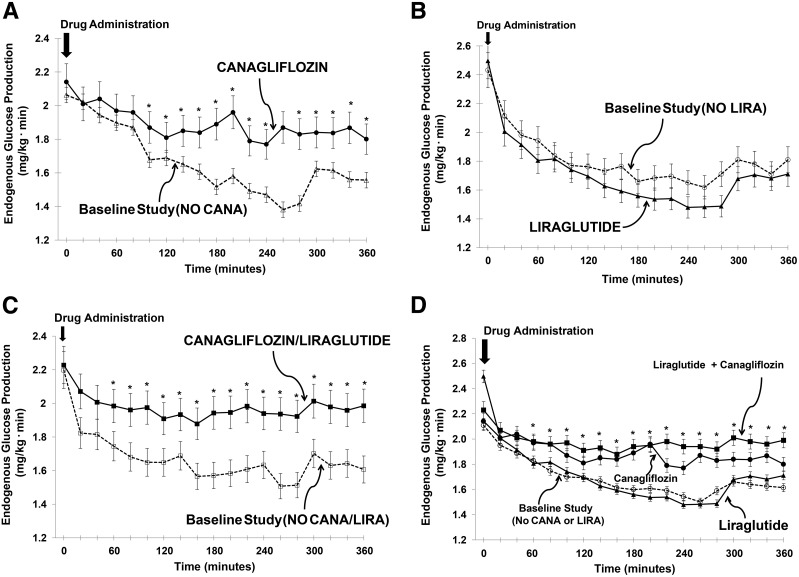
Figure 1.
EGP during the baseline study and after drug administration. The mean ± SEM rate of EGP (mg/kg ⋅ min) from 0 to 360 min in the baseline study (dotted line and open symbols) and after drug administration (solid line and solid symbols) is depicted. A single dose of CANA (A) significantly attenuated the decrease in EGP by ∼50%. When subjects received a single injection of LIRA, there was no change in EGP (B). After the administration of CANA/LIRA, the decline in EGP was attenuated by ∼50% (C), i.e., similar to results with CANA alone (A). Comparable results were obtained when the data in each of the baseline studies without drug administration were averaged and compared with drug treatment (D). *P < 0.05, CANA and CANA/LIRA vs. baseline study and vs. LIRA.

