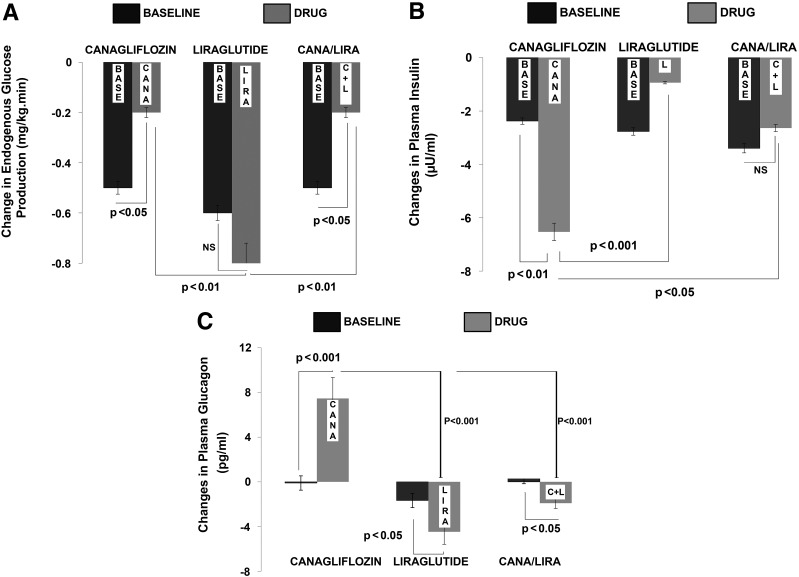
Figure 2.
Mean ± SEM changes in EGP (A) and in plasma insulin (B) and glucagon (C) concentrations during the 300- to 360-min time period in the baseline (BASE) study and after each drug administration. After a single dose of CANA, there was a significant ∼50% reduction in EGP (A, left) compared with the baseline study. A similar reduction was observed when CANA and LIRA were administered in combination (A, right). After a single injection of LIRA, there was no significant change in EGP (A, center). The reduction in EGP after CANA was similar to that seen after the combination treatment with CANA/LIRA injection, but both were statistically different (P < 0.01) compared with the change seen with LIRA injection alone. After a single dose of CANA, there was a significant reduction in plasma insulin concentration compared with the baseline study (B, left). After a single injection of LIRA, there was a small nonsignificant attenuation in the decrease in plasma insulin concentration (P = NS) from baseline (B, middle). When LIRA was administered with CANA, there was no change in plasma insulin concentration (B, right). The reduction in plasma insulin after CANA was significantly greater than that with LIRA alone (P < 0.001) and that after combination treatment with CANA/LIRA (P < 0.05). After CANA administration, the elevation in plasma glucagon concentration was significantly greater than during the baseline study (C, left). In contrast, with both LIRA alone (C, middle) and CANA/LIRA (C, left), plasma glucagon decreased slightly. The increase in plasma glucagon after CANA was significantly greater and went in a direction opposite that observed after the LIRA injection (P < 0.001) and also after the combination treatment with CANA/LIRA (P < 0.001). C+L, combination treatment with CANA/LIRA injection.

