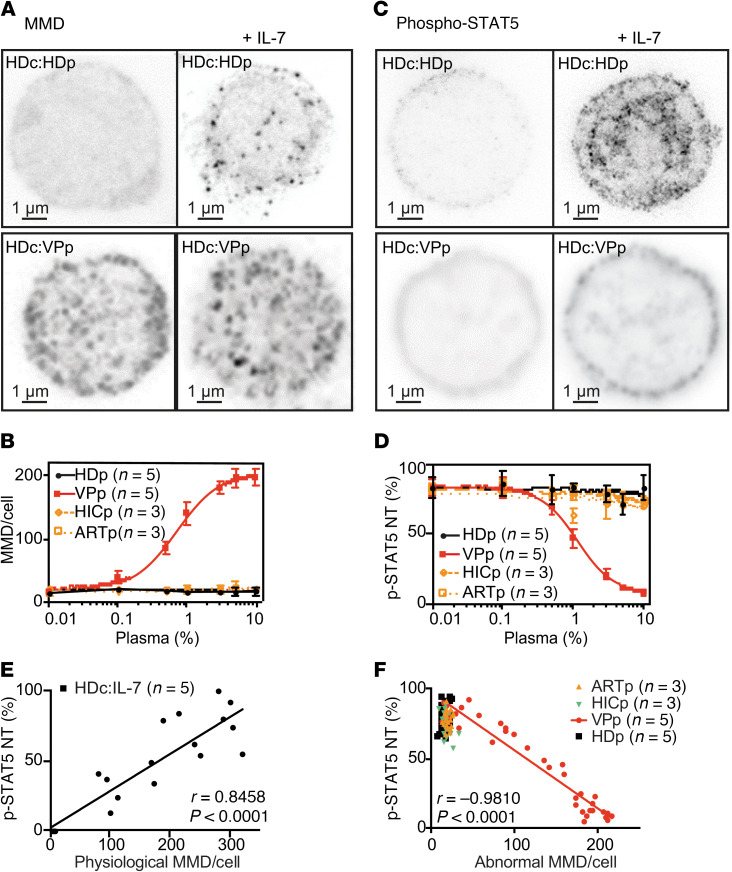
Figure 3. Induction of Bumpy CD4+ T cells by plasma from HIV-infected patients.
(A) CW-STED images of MMDs on HD CD4+ T cells treated with 10% HD plasma (HDc:HDp) or VP plasma (HDc:VPp) before and after IL-7 stimulation. (B) Dose effect of plasma from HD (HDp, n = 5), VP (VPp, n = 5, HIV RNA/mL = 49,144 ± 33,689), HIV-controllers (HICp, n = 3), and ART-treated donors (ARTp, n = 3) on the number of MMDs per HD CD4+ T cell. (C) Pulsed-STED images of p-STAT5 of HD CD4+ T cells pretreated with 10% plasma from HDs or VPs. (D) Plasma dose effects as in B on p-STAT5 NT in IL-7–treated HD CD4+ T cells. Data are represented as the mean ± SD. In A–D, for each condition, an average of 50 HD CD4+ T cells were analyzed from 5 donors and representative images are shown in A and C. (E) Pearson’s correlation between the kinetics of p-STAT5 NT and the number of physiological MMDs throughout IL-7 activation of HD cells (up to 60 minutes). Linear regression for the mean of the 5 HD plasma samples is shown. (F) Pearson’s correlation between p-STAT5 NT and abnormal MMDs per HD CD4+ T cell treated with various amounts of HDp (n = 5), VPp (n = 5, HIV RNA/mL = 49,144 ± 33,689), HICp (n = 3), and ARTp (n = 3). Linear regression for the mean of the 5 VP plasma samples is shown.

