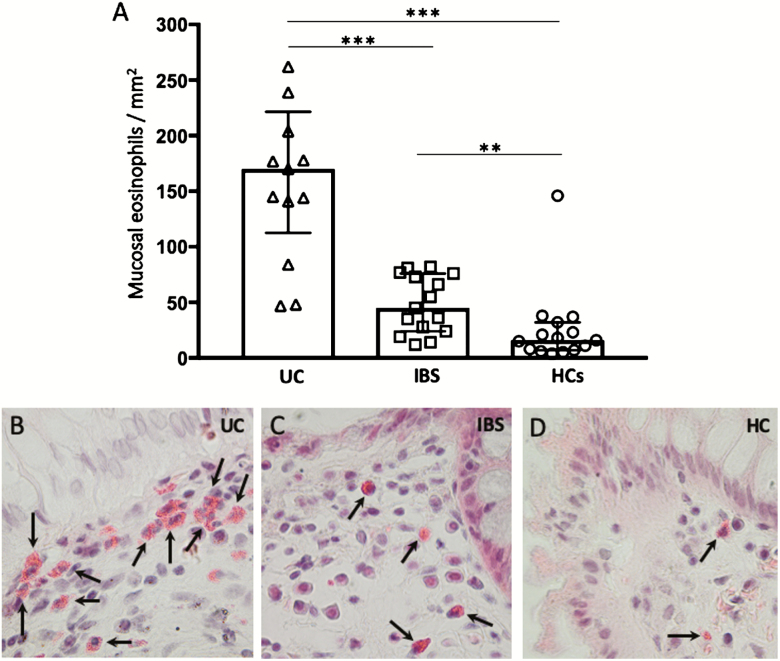
FIGURE 5.
A, Graph showing mucosal eosinophils quantified by hematoxylin and eosin staining in colonic biopsies from patients with ulcerative colitis in remission, irritable bowel syndrome, and healthy controls. B–D, Photographs illustrating cells positive for eosin (arrows) in the colonic mucosa of UC, IBS, and HC, respectively. Magnification 600X. Bars represent median (25th–75th percentile), and comparisons between 2 groups were done with Mann-Whitney U test. **P < 0.005, ***P < 0.0005.

