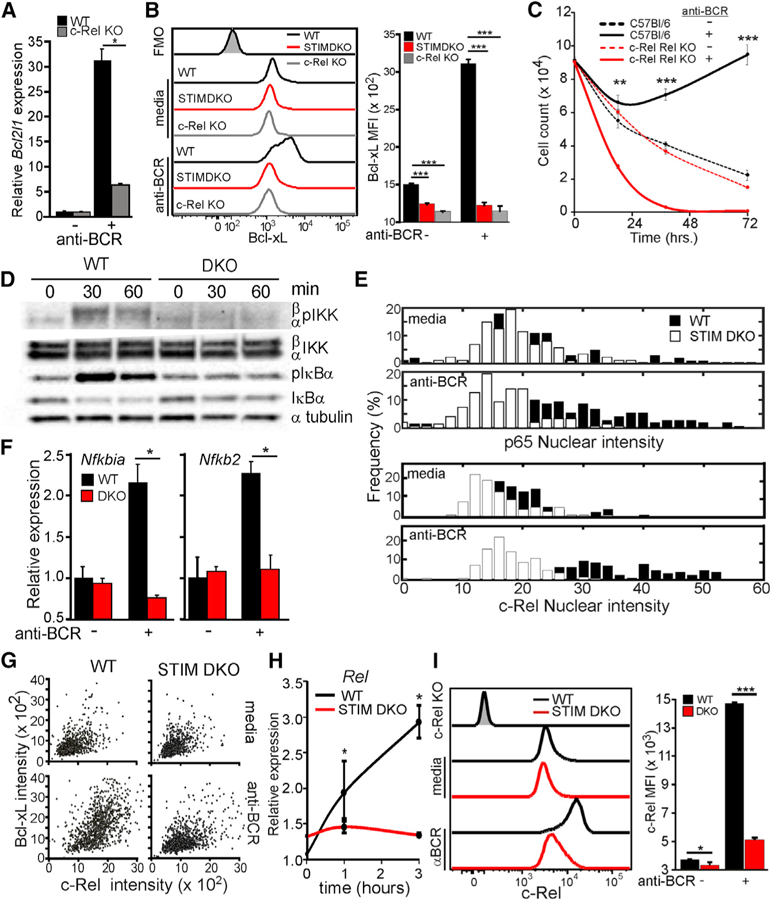
Figure 3. Ca2+ Entry Regulates NF-κB-Dependent Anti-apoptotic Gene Expression.

(A) Bcl2l1 expression after 6 h of anti-BCR stimulation in CD23+ B cells from WT and c-Rel KO mice (mean ± 95% confidence interval; *, statistically significant).
(B) Intracellular Bcl-xL protein levels (relative to FMO, gray shaded histogram) in CD23+ B cells from WT (black line), STIM DKO (gray line), and c-Rel KO (red line) mice 6 h after anti-BCR stimulation (left) and mean (median flourescence intensity (MFI) ± SD from triplicate wells) Bcl-xL fluorescence intensity (right).
(C) CD23+ B cells from WT (solid line) and c-Rel KO (dashed line) mice were cultured for indicated times in media alone or media containing anti-BCR. The total number of live cells was enumerated, and mean cell number (±SD of triplicate wells) is plotted for the indicated time points.
(D) Immunoblot of anti-BCR-dependent NF-κB activation in CD23+ WT and STIM DKO B cells at indicated time points.
(E) p65 (top) and c-Rel (bottom) nuclear localization in unstimulated (media) and anti-BCR stimulated (2 h) WT (black) and STIM DKO (white) B cells. Overlay of average c-Rel and p65 nuclear cell intensity (>70 cells per group) is shown.(F) Nfkbia (IκBα) and Nfkb2 (p100) mRNA expression in CD23+ B cells from WT and STIM DKO mice cultured for 3 h in the presence or absence of anti-BCR (mean ± 95% confidence interval; *, statistically significant).
(G) Scatterplot of c-Bcl-xL and Rel expression in individual WT (left) and STIM DKO (right) B cells cultured in the absence (media) and presence of anti-BCR for 20 h.
(H) Time course of anti-BCR-induced Rel expression in CD23+ B cells from WT and STIM DKO mice (mean ± 95% confidence interval; *, statistically significant).
(I) c-Rel expression in WT (black line) and STIM DKO (red line) B cells cultured for 12 h with anti-BCR. (Left) Mean c-Rel MFI (±SD from triplicate wells, right). For all figures except where indicated, *p < 0.05, **p < 0.01, ***p < 0.001. See also Figure S2.
