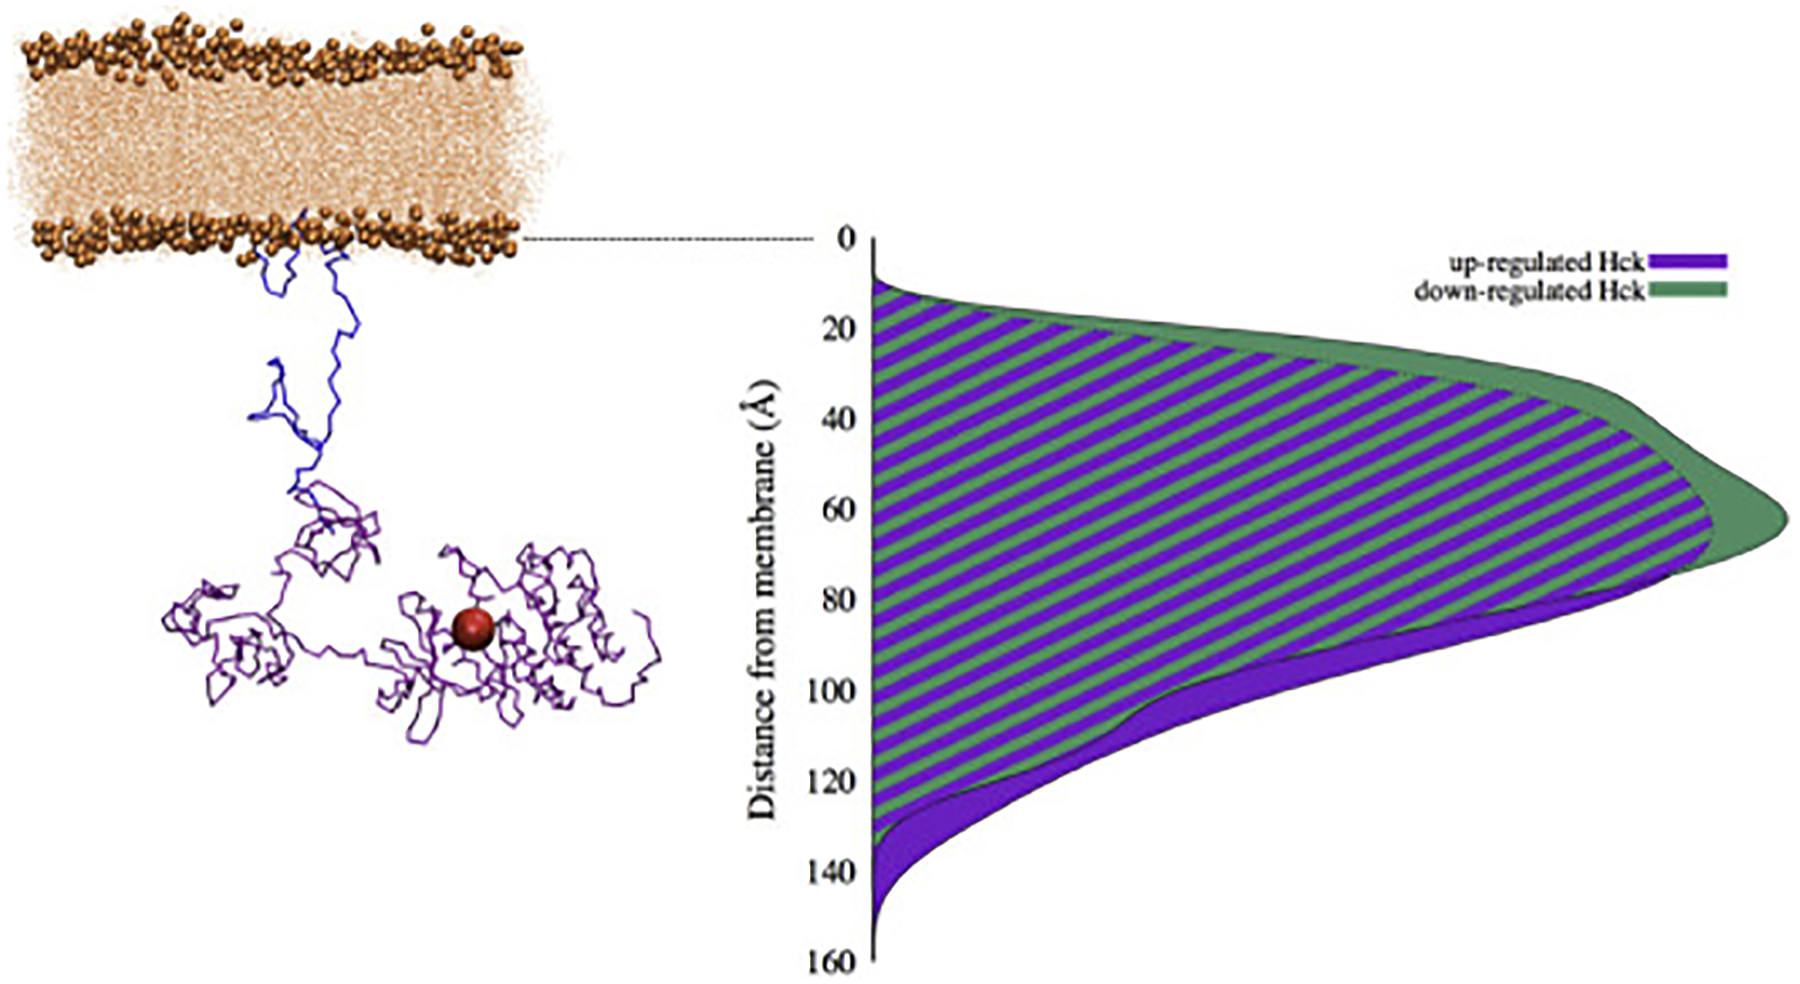
Figure 7:

Model of membrane-anchored Hck. On the left is an illustrative example of up-regulated Hck conformation generated from re-MD and SAXS results. HckSH4–U is shown in blue and the folded domains and C-tail from SAXS (HckSAXS) in purple, with the position of the active site represented by a red sphere. B) Distributions for the up-regulated (purple) and down-regulated (green) SAXS clusters generated from the modeling procedure.
